
TradingView chart tools let you apply technical indicators to Deriv instruments and use Pine Script® to create custom chart calculations. Built-in indicators provide ready-made calculations for analysing characteristics such as trend and momentum, while Pine Script lets you define, customise, and reuse your own calculations.
In this walkthrough, you will add and customise a moving average and Relative Strength Index (RSI), save your chart setup, and create a simple two-moving-average indicator with Pine Script version 6.
Before we start, it is important to remember that indicators organise and visualise price data; they do not predict future market movements with certainty. Understand what an indicator calculates and test your setup before using its output in a trading decision.
Quick summary
- TradingView's built-in indicators let you apply ready-made calculations to Deriv chart data.
- Moving averages can help visualise price trends, while RSI measures the speed and magnitude of recent price changes.
- Pine Script lets you create custom indicators and control their calculations, inputs, and chart plots.
- Changing an indicator's settings can materially change its output, so understand and test each configuration before using it.
Why use indicators on Deriv charts?
Indicators organise price data into calculations that can help you examine characteristics such as trend, momentum, and volatility consistently.
For example, a moving average smooths price data over a specified number of bars. The Relative Strength Index (RSI) is a momentum indicator that measures the speed and magnitude of recent price changes.
Pine Script adds another level of customisation. Instead of relying only on built-in indicators, you can define calculations and visual rules and display their results on a TradingView chart.
This can be useful when you want to:
- apply consistent analysis rules across different Deriv instruments
- adjust calculation inputs without redrawing chart elements
- create visual outputs for conditions you define
- examine how an idea behaves on historical chart data before considering live use
Built-in indicators provide ready-made calculations. Pine Script lets you create or adapt those calculations when you need a more customised chart tool.
How do you add indicators to a Deriv chart?
Step 1: Open the Deriv instrument
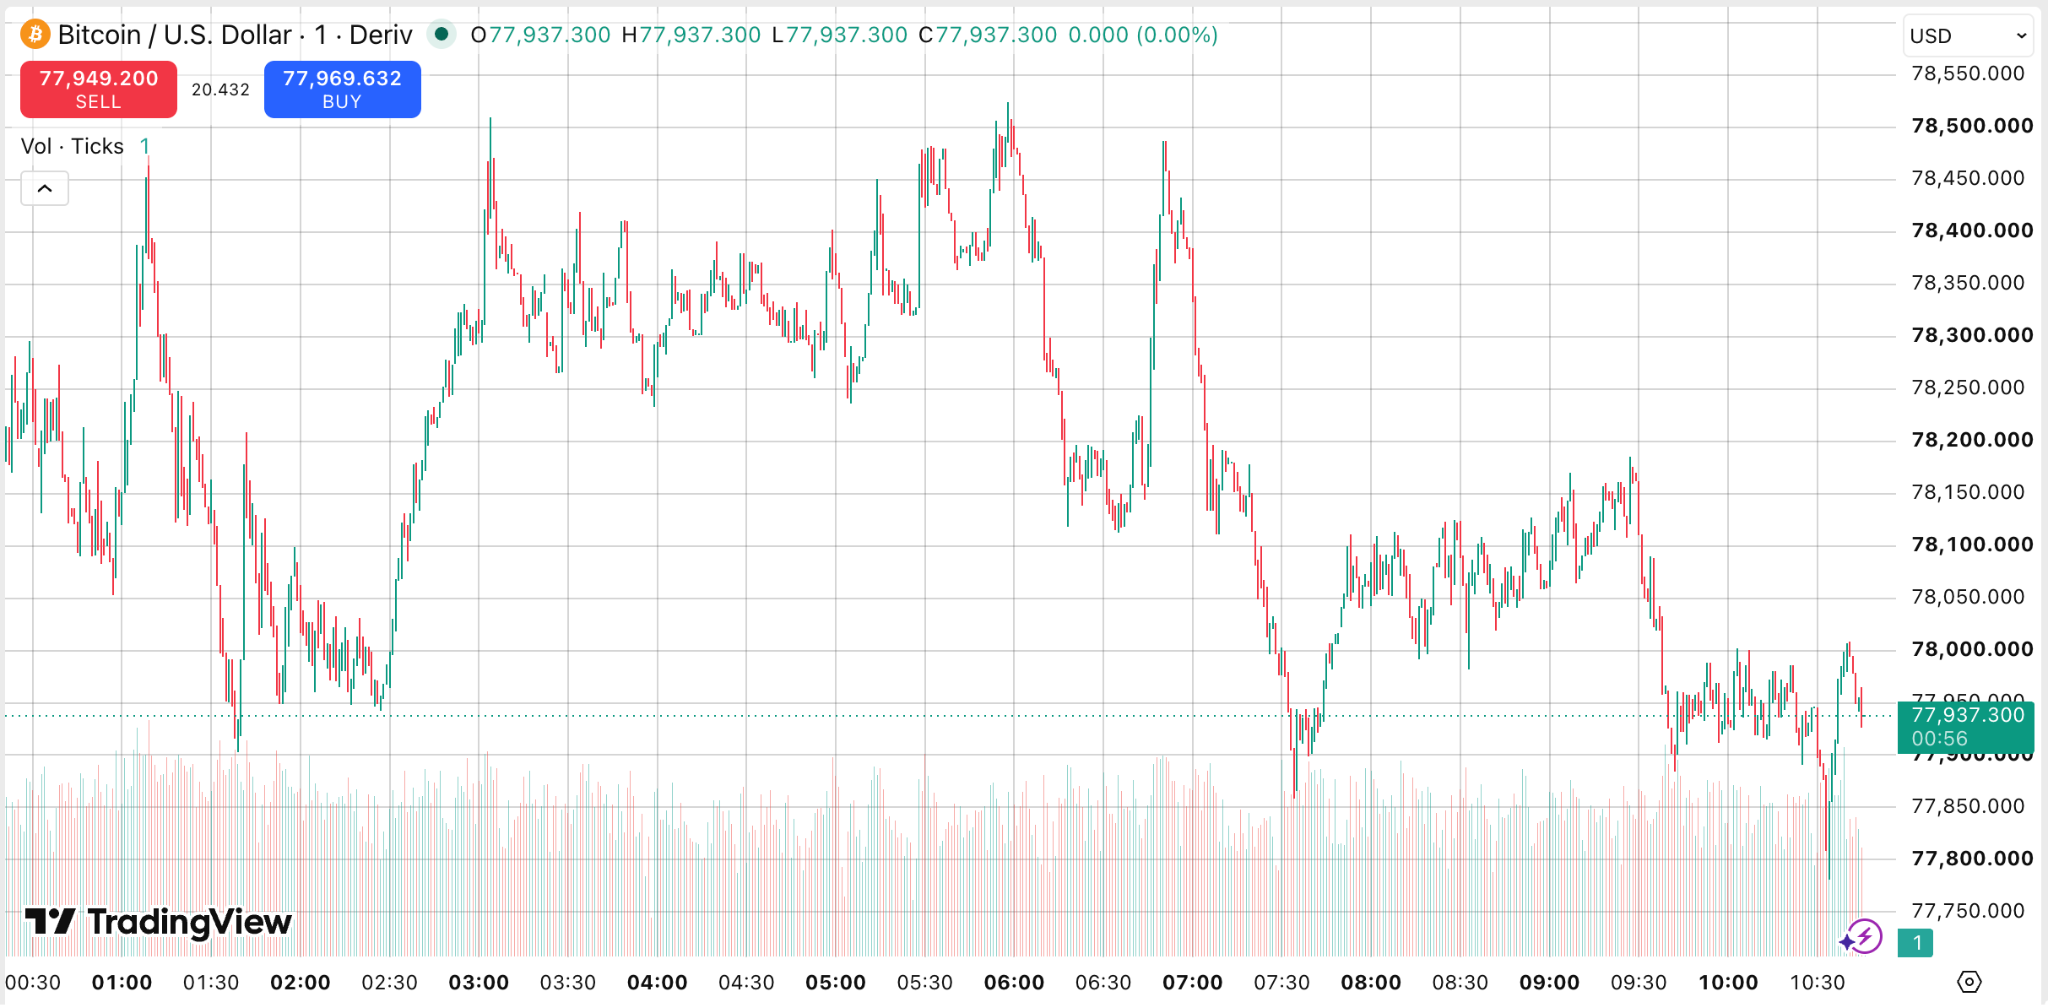
Use symbol search to open the Deriv instrument you want to analyse. Check that you have selected the intended instrument and data source, then choose a chart type and timeframe suited to the question you are examining.
Step 2: Open the Indicators menu
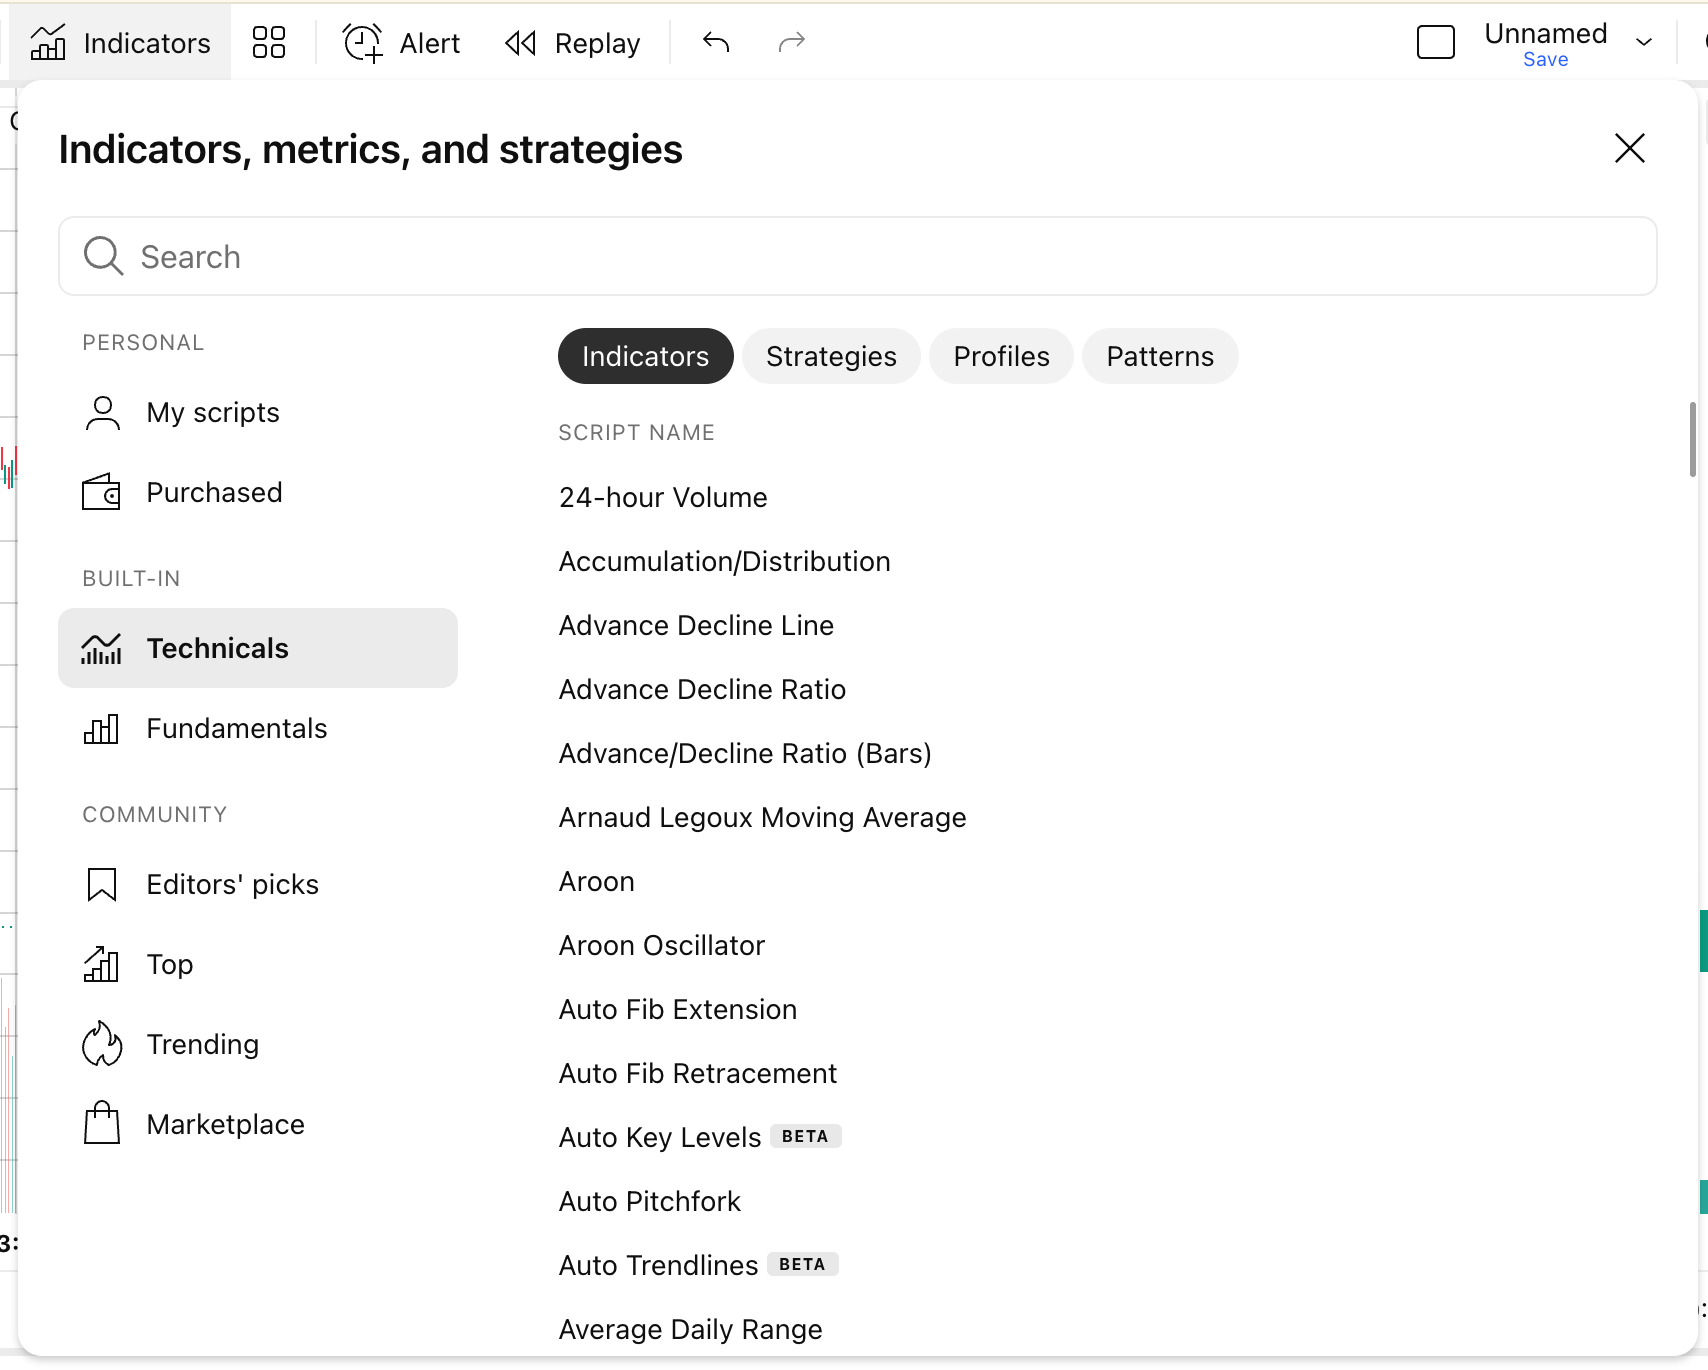
Select Indicators on the top toolbar. The indicator window contains built-in tools and community scripts, alongside other available categories.
Step 3: Add a moving average and RSI
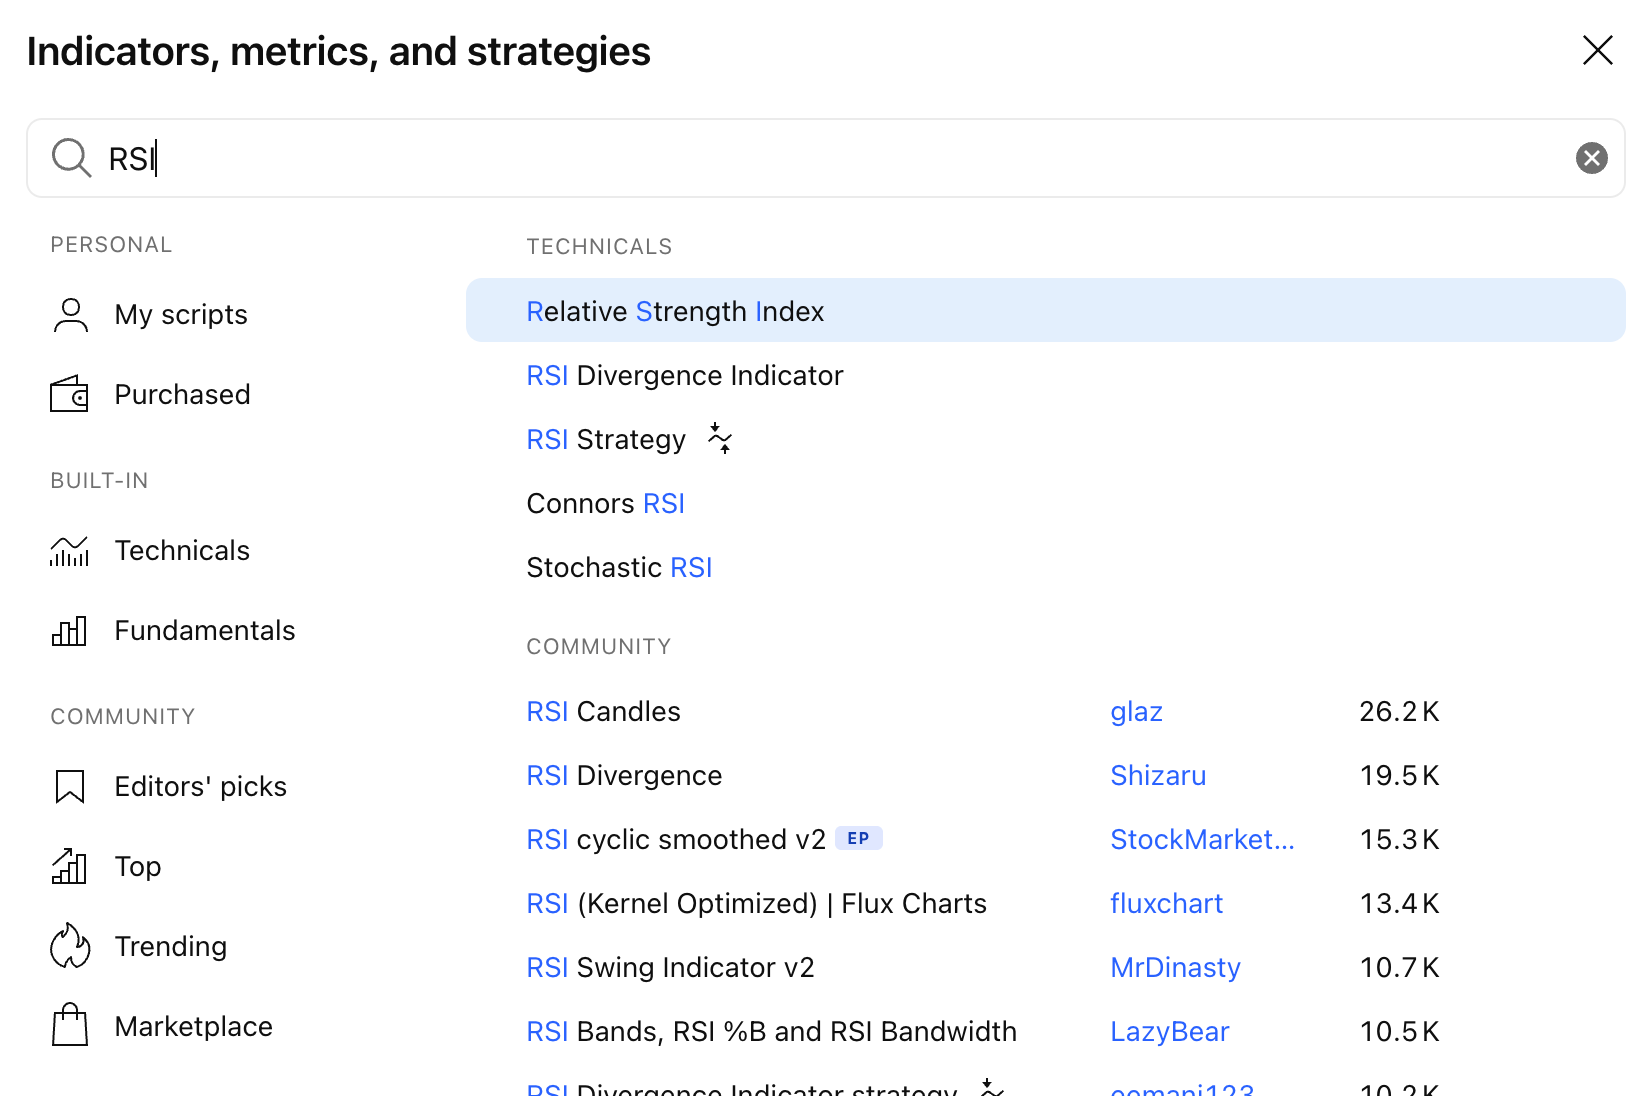
Search for an indicator by name. For this walkthrough, add a Moving Average to the price chart and Relative Strength Index (RSI) in a separate pane.
The moving average smooths price data across a chosen number of bars, making changes in the broader price direction easier to visualise. RSI measures momentum based on recent price movements.
Give every indicator a defined analytical purpose. Adding several indicators simply because they are commonly used can make a chart harder to interpret without necessarily improving the analysis.
Step 4: Change the indicator inputs
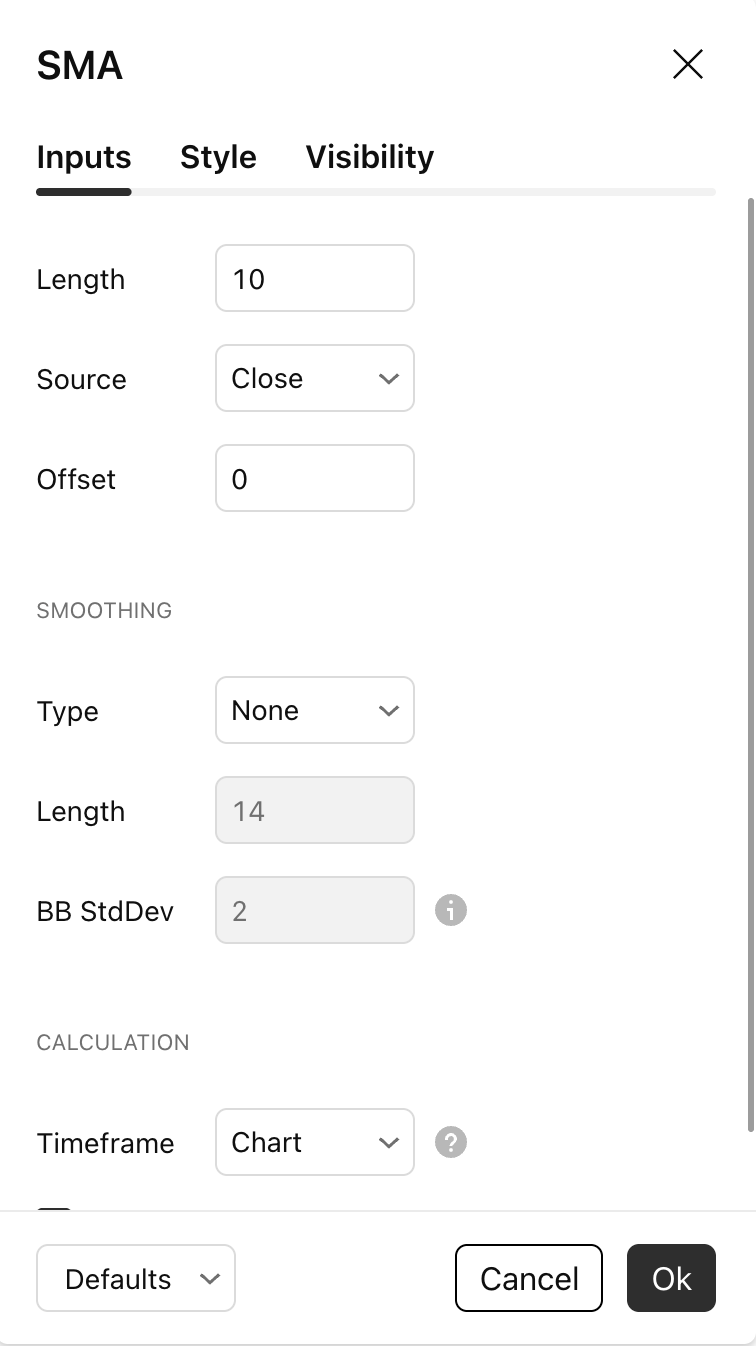
Hover over the indicator name on the chart and select Settings. Under Inputs, adjust parameters only when you understand what they change.
For a moving average, the length determines how many chart bars contribute to the calculation. A 10-period moving average, for example, calculates its value using 10 bars of price data at each point.
A shorter length generally reacts more quickly to price changes. A longer length generally produces a smoother line that reacts more slowly. Neither setting is inherently better; the appropriate input depends on what you are trying to examine.
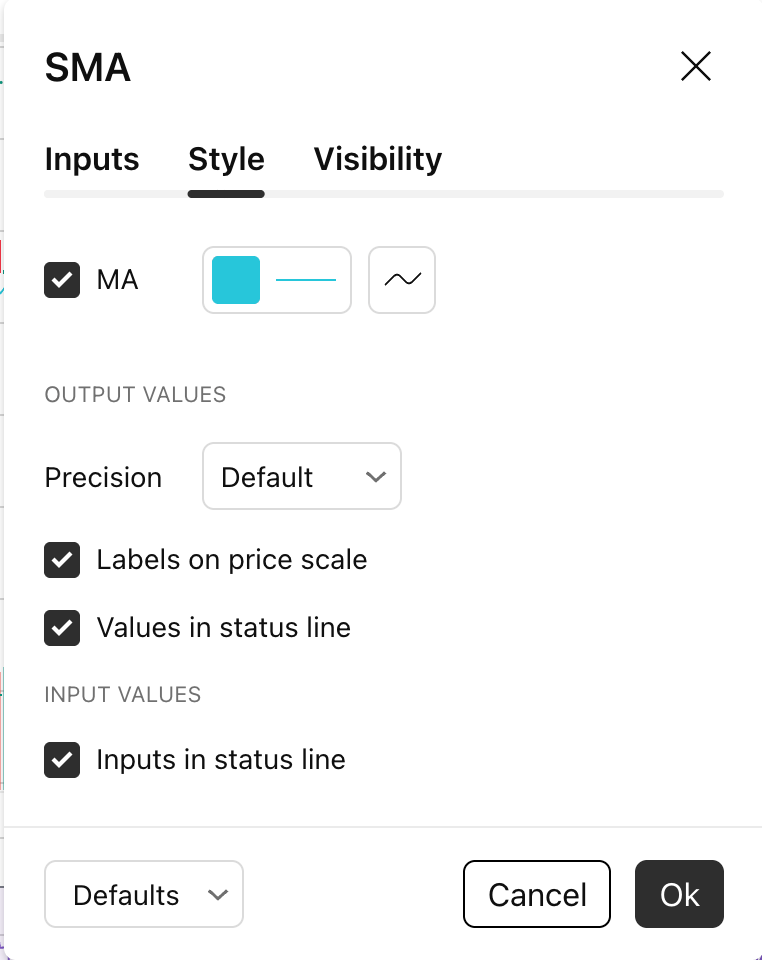
Step 5: Adjust style and visibility
Use Style to change characteristics such as the plot colour, thickness, or visibility. Use Visibility to choose the timeframes on which the indicator appears, where that option is available.
Choose colours with enough contrast against the chart background. Avoid adding so many indicators that the underlying price movement becomes difficult to read.
Step 6: Save the chart layout
Save the chart layout if you want TradingView to retain your indicators and chart settings. Use a descriptive layout name so that its purpose is easy to recognise later, such as Deriv — trend and momentum practice.

How do you create a Pine Script indicator?
Pine Script is TradingView's programming language for creating custom chart tools. In this example, you will use Pine Script version 6 to calculate and display two simple moving averages.
A Pine indicator calculates and displays information on a chart. A Pine strategy is different: it can define trading rules that TradingView can simulate against historical data.
This walkthrough creates an indicator, not a trading strategy.
Step 1: Open Pine Editor
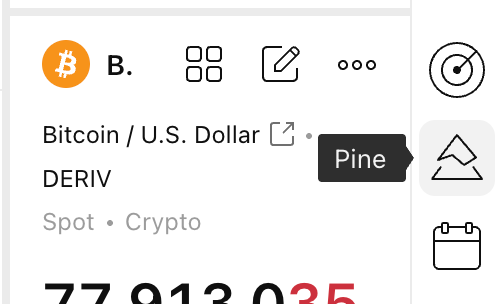
On TradingView’s web chart, click the Pine icon on the right toolbar to open Pine Editor.
Step 2: Create a new Pine indicator
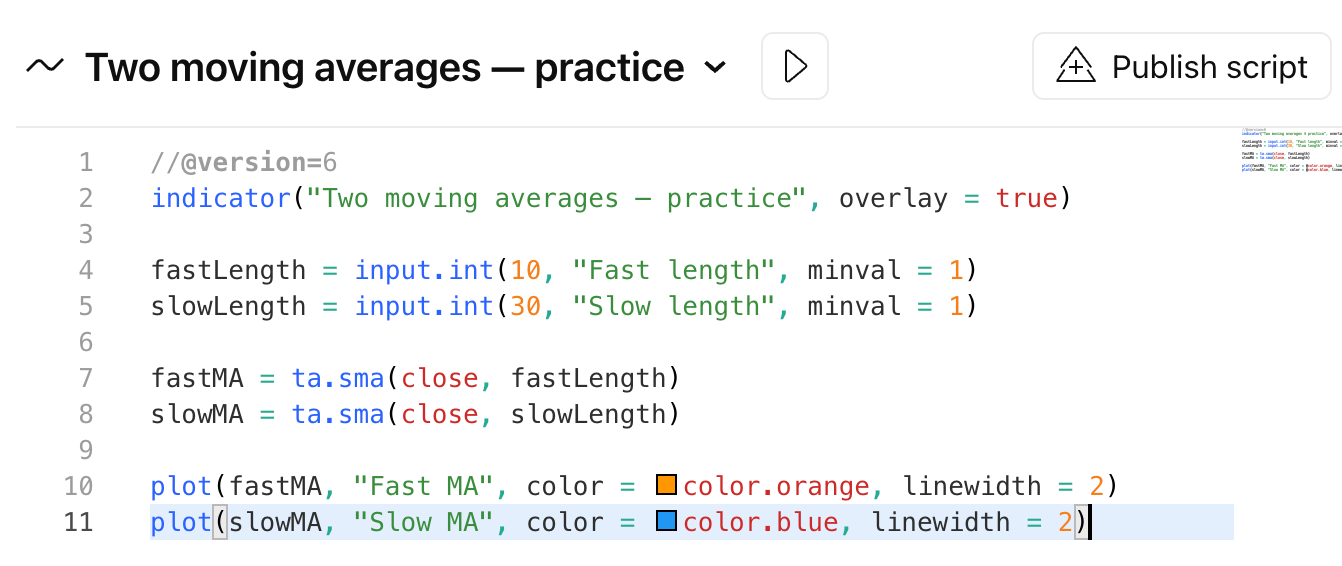
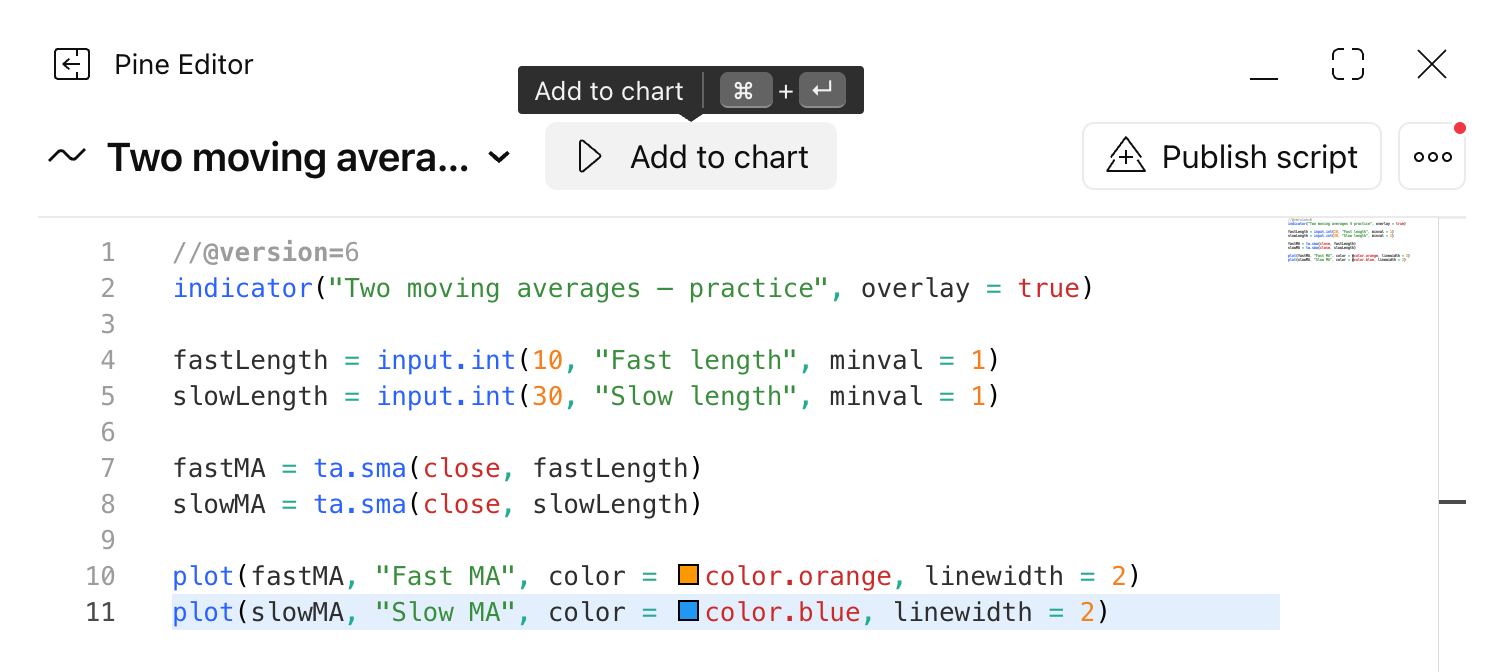
Open the editor menu and choose the option to create a new indicator. Replace the template code with this example:
//@version=6
indicator("Two moving averages — practice", overlay = true)
fastLength = input.int(10, "Fast length", minval = 1)
slowLength = input.int(30, "Slow length", minval = 1)
fastMA = ta.sma(close, fastLength)
slowMA = ta.sma(close, slowLength)
plot(fastMA, "Fast MA", color = color.orange, linewidth = 2)
plot(slowMA, "Slow MA", color = color.blue, linewidth = 2)The script draws two simple moving averages over the price chart.
input.int() creates an integer input that you can later change through the indicator's settings. In this example, the default lengths are 10 and 30.
ta.sma() calculates a simple moving average. The script applies it to closing prices using the fast and slow lengths defined above.
The two plot() calls then display those calculations as orange and blue lines on the chart.
Step 3: Save your Pine Script
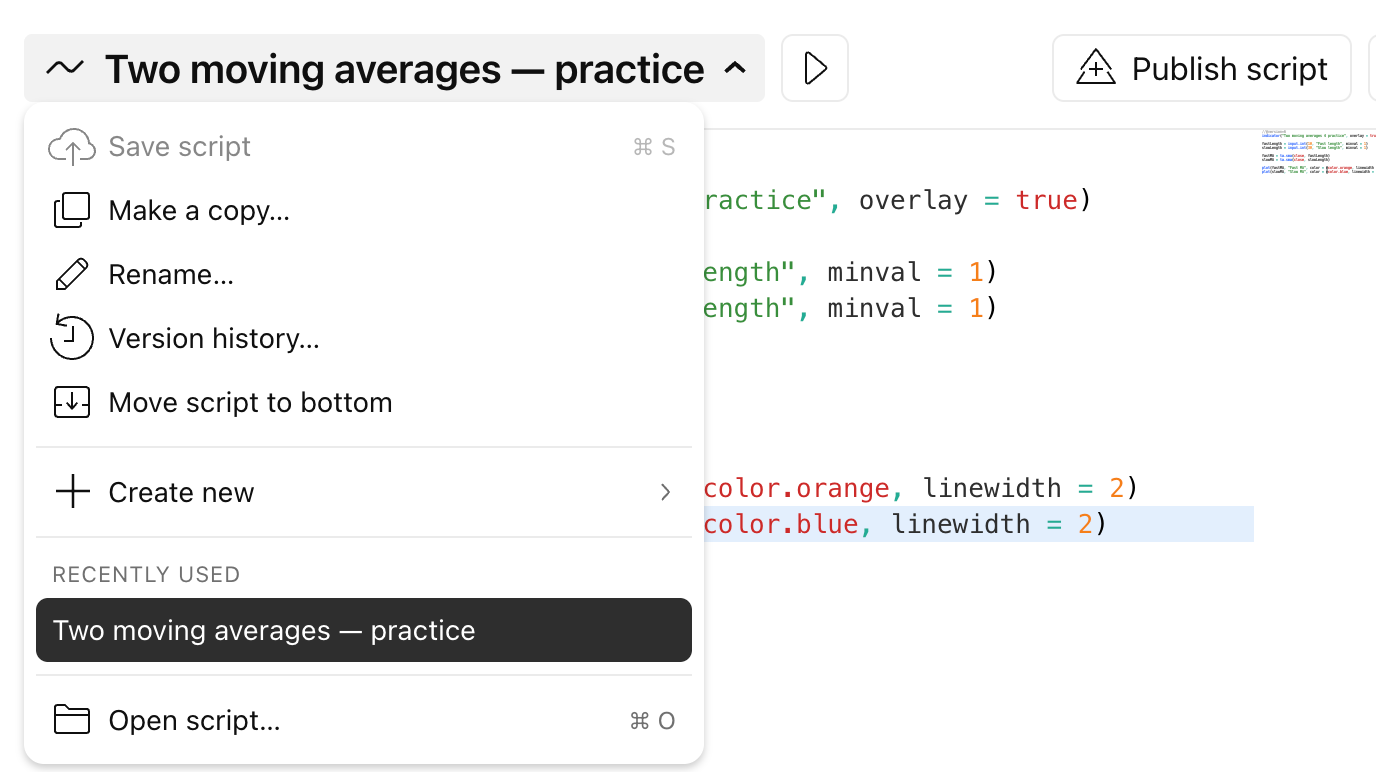
Select Save, then give the script a descriptive name. Saving your work lets you identify and reopen the script later.
Use names that distinguish different versions if you make significant changes to the calculation or its purpose.
Step 4: Add the indicator to the chart
TradingView Basic allows two indicators per chart. If you already added the moving average and RSI from the earlier steps, remove the original moving average first. The custom script will replace it with two moving-average lines.
Select Add to chart. The two moving averages should appear over the price chart.
If the editor reports an error, check the highlighted line and error message. Look for differences between your script and the example, such as missing characters or accidentally altered code.
Step 5: Change the custom indicator inputs
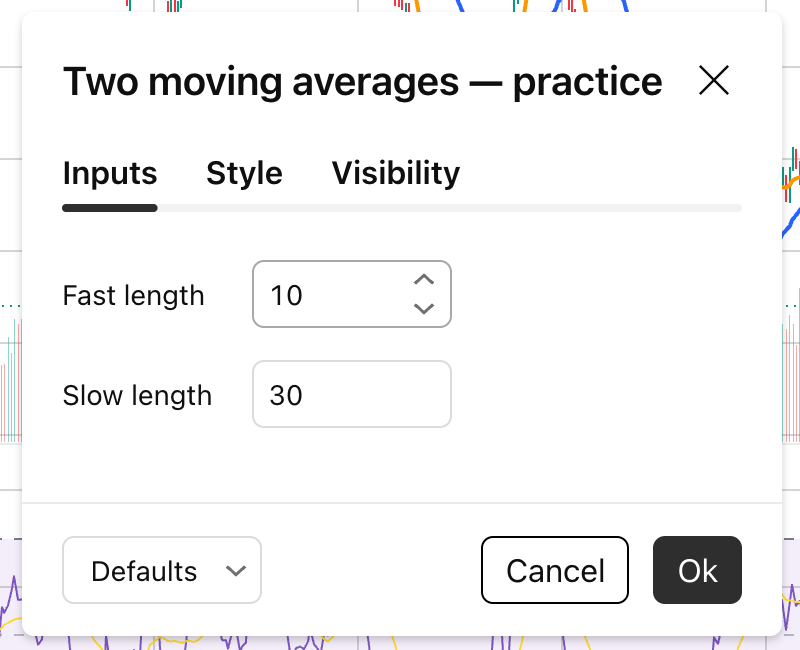
Open the custom indicator's Settings and change the fast or slow length.
Because the script defines these values with input.int(), you can adjust them through the settings interface without editing the source code.
Changing the fast length alters the number of closing-price bars used for the orange moving average. Changing the slow length does the same for the blue moving average.
Step 6: Edit or remove the Pine indicator
To remove the indicator, use the remove control beside its chart label.
To change the script itself, return to Pine Editor, edit the code, save the change, and add or update the saved version on the chart as appropriate.
Keep the purpose of each saved version clear. Even a small change to the calculation or inputs can materially alter what the chart displays.
How do you read the moving-average example?
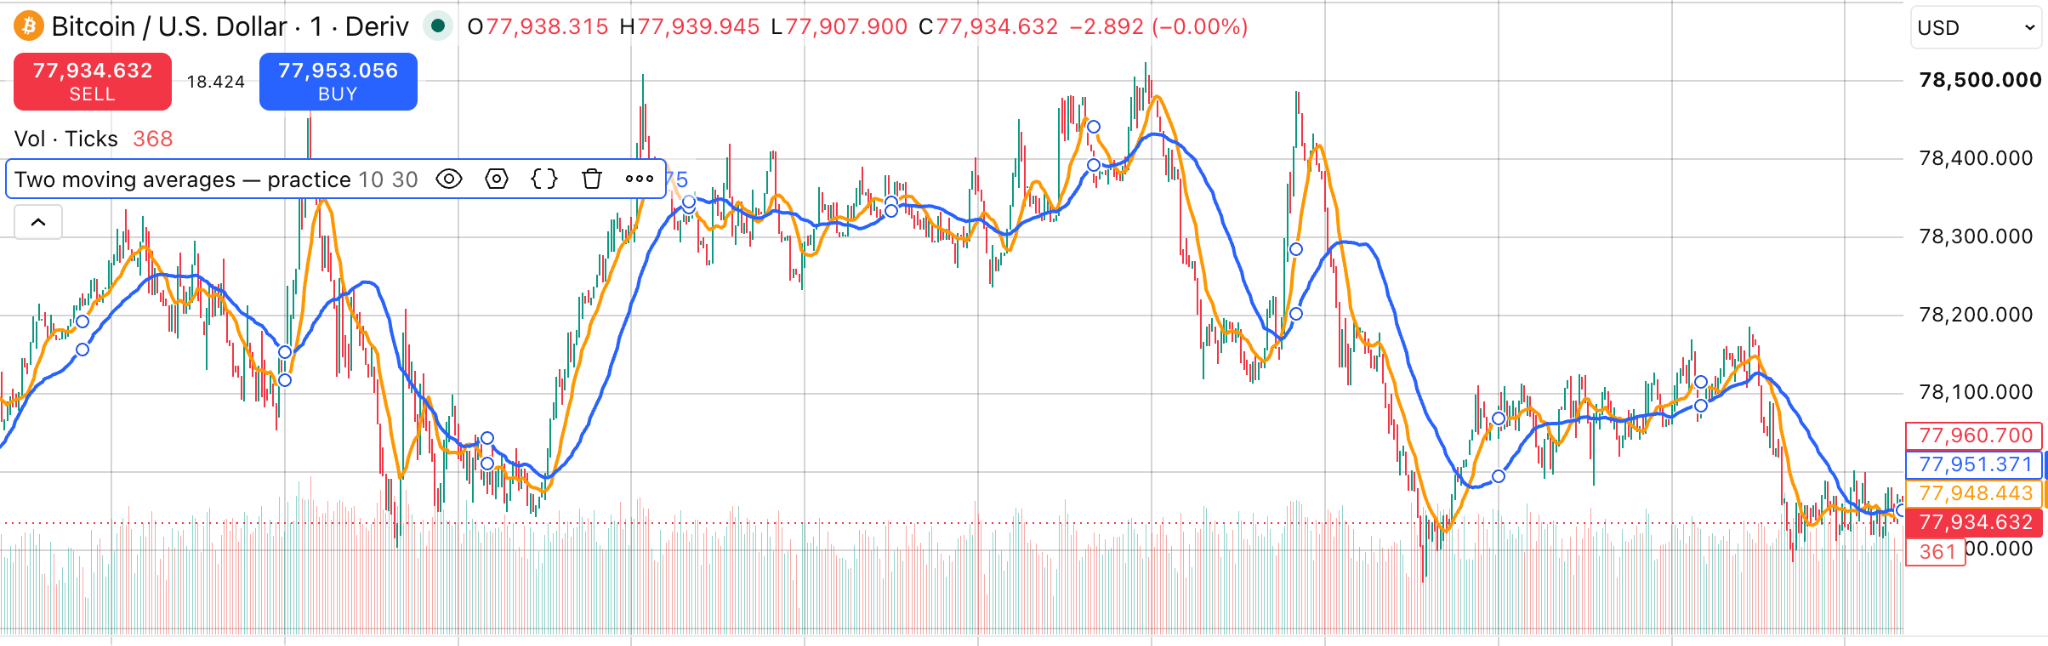
The orange line calculates a simple moving average from the last 10 closing prices by default. The blue line uses the last 30.
Because the 10-period calculation uses fewer bars, it generally responds more quickly as new prices enter the calculation. The 30-period calculation incorporates more bars and is therefore generally smoother and slower to respond.
If you change either input, you change the data window used in that calculation and therefore the line displayed on the chart.
The lines' relative positions describe the output of the two calculations. They do not prove what the price will do next or provide certainty about future market direction.
What is the difference between Pine indicators and strategies?
A Pine indicator performs calculations and displays their output on a chart. The two-moving-average script in this walkthrough is an indicator because it calculates and plots two lines.
A Pine strategy defines trading rules that can be simulated against historical chart data. TradingView can then use those rules to produce historical strategy-testing results.
Backtest results depend on factors including the strategy's settings, available data, fees, slippage assumptions, and coding choices. Historical performance does not guarantee future performance.
What should you remember when using indicators?
- Start with a specific analytical question and one or two relevant indicators.
- Understand what an indicator calculates before interpreting its output.
- Review community scripts carefully because they are created by third parties and may rely on assumptions that do not suit every instrument.
- Remember that Pine indicators display calculations, while Pine strategies can simulate defined trading rules.
- Save and label script versions when changing calculations or code.
- Avoid treating indicator signals or historical tests as predictions of future performance.
- Test your setup on a demo account before considering live trading.
Quiz
FAQs