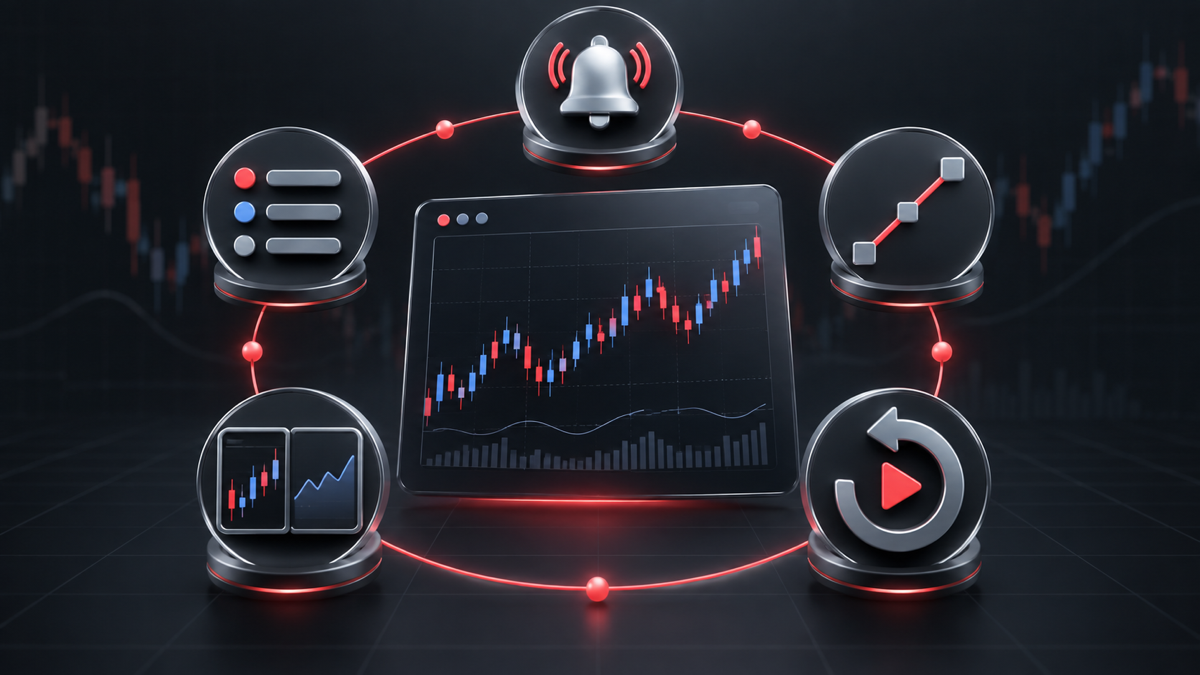
TradingView provides charting and analysis tools that you can use with your Deriv account to organise instruments, analyse price charts, monitor conditions, and practise your process. This guide explains how to combine five TradingView features — watchlists, drawing tools, alerts, chart layouts, and Bar Replay — into a repeatable workflow for analysing Deriv instruments.
Quick summary
- Watchlists keep the Deriv instruments you monitor in one place.
- Drawing tools help you mark levels and other areas you want to review.
- Alerts notify you when supported conditions are met.
- Chart layouts let you save and reuse your analysis setup.
- Bar Replay lets you practise analysing historical chart conditions.
- Used together, these tools create a workflow from selecting an instrument to analysing, monitoring, and practising.
These features support analysis and practice. They do not remove trading risk or guarantee a result.
Why use a TradingView workflow with Deriv?
A repeatable TradingView workflow can help you spend less time rebuilding charts and more time applying the same analysis process consistently.
The five features work together rather than as isolated tools. You can select a Deriv instrument from a watchlist, open a saved layout, mark areas you want to monitor, create an alert for a relevant condition, and use Bar Replay separately to practise analysing historical conditions.
TradingView provides the charting and monitoring tools in this workflow. Your connected Deriv account provides access to supported Deriv instruments and trading functionality.
Before you start
Connect your Deriv account to TradingView and open a supported Deriv instrument.
Feature limits and availability can vary by TradingView plan, device, region, and instrument. Check the current TradingView and Deriv information relevant to your account before relying on a particular feature.
1. Organising your Deriv instruments with a TradingView watchlist
A watchlist gives you a focused starting point by keeping the instruments you want to review together.
Step 1: Open Watchlist
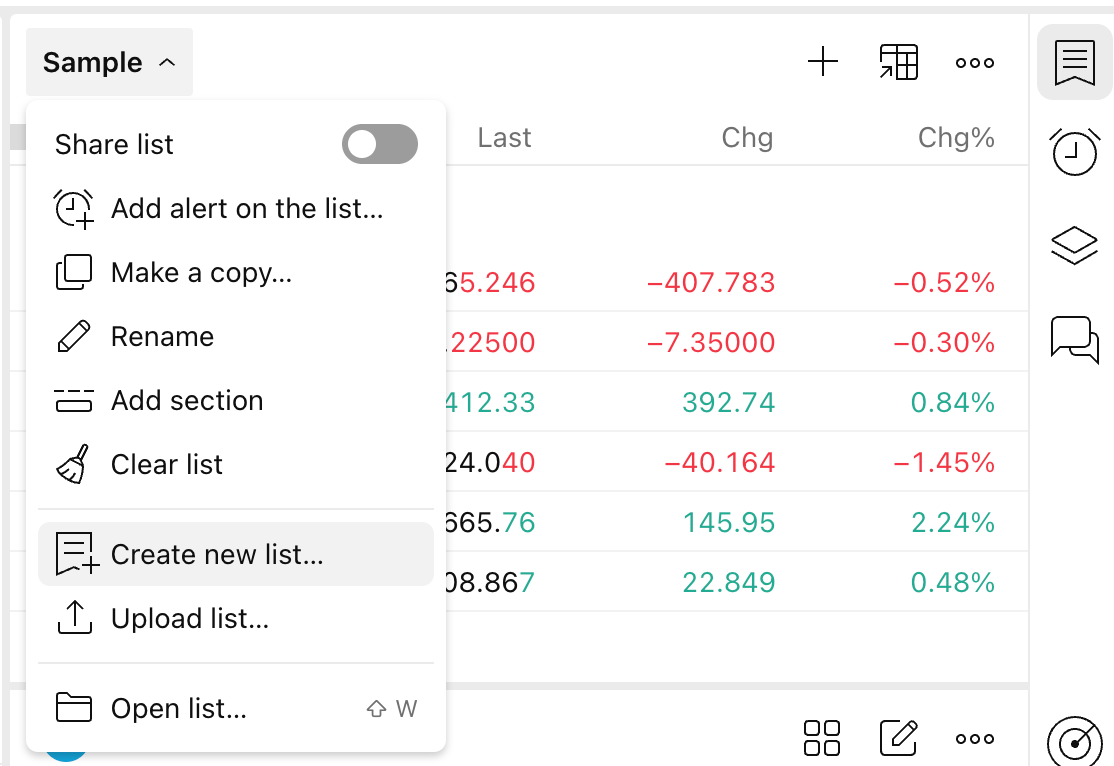
Open Watchlist on the right toolbar. Use your existing list, or create another if your plan supports multiple watchlists. TradingView Basic allows one watchlist.
Step 2: Add Deriv instruments
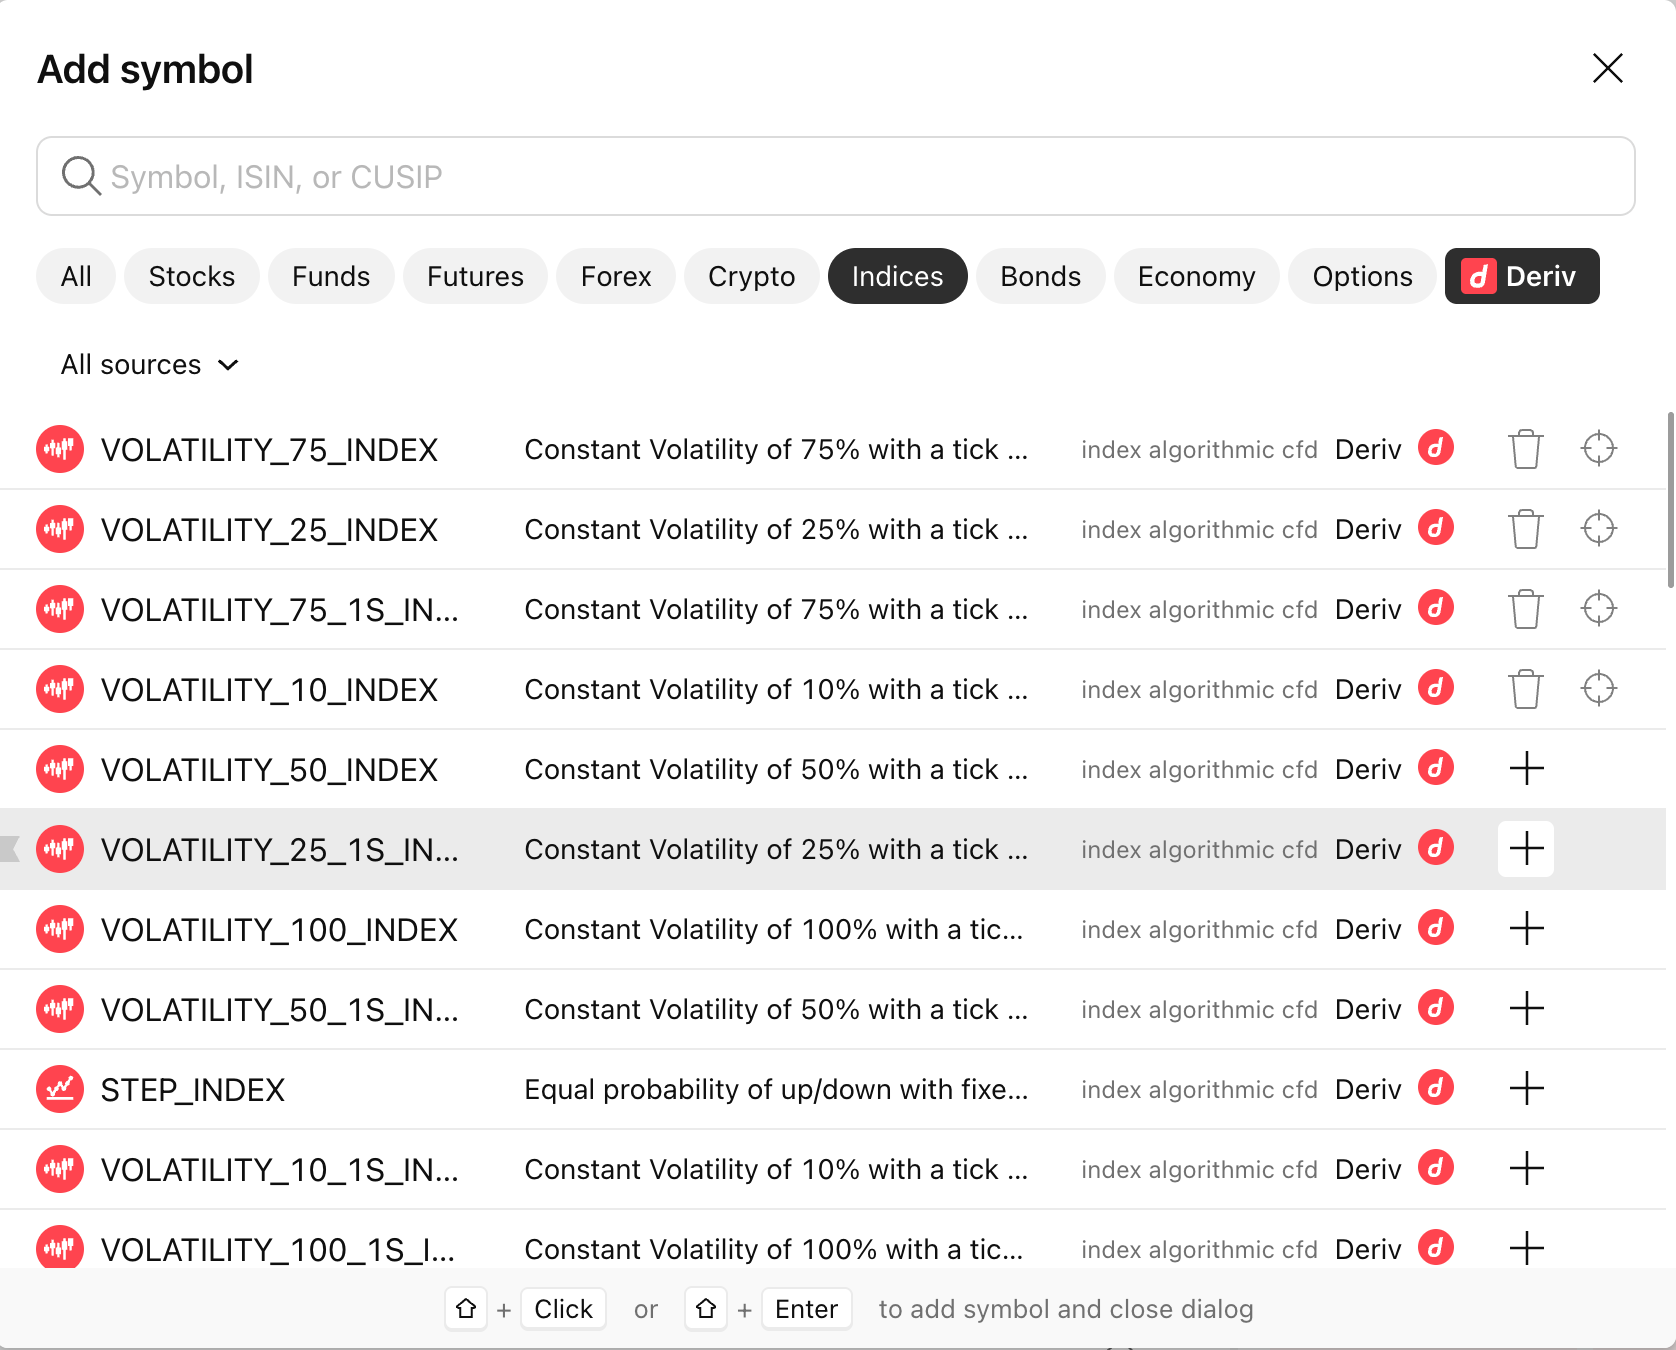
Use Add symbol to search for the Deriv instruments you want to follow. Confirm the source or provider before adding each result so that you select the intended instrument.
Keep the list short enough to review consistently. Drag items to reorder them, and use section headers where available to group instruments by market type or workflow stage.
Once you choose an instrument from the watchlist, open it in the chart layout you use for analysis.
2. Marking chart levels with TradingView drawing tools
Drawing tools let you mark areas on a Deriv chart that are relevant to your analysis. They act as visual annotations based on your method rather than objective trading signals.
Step 1: Choose a drawing tool
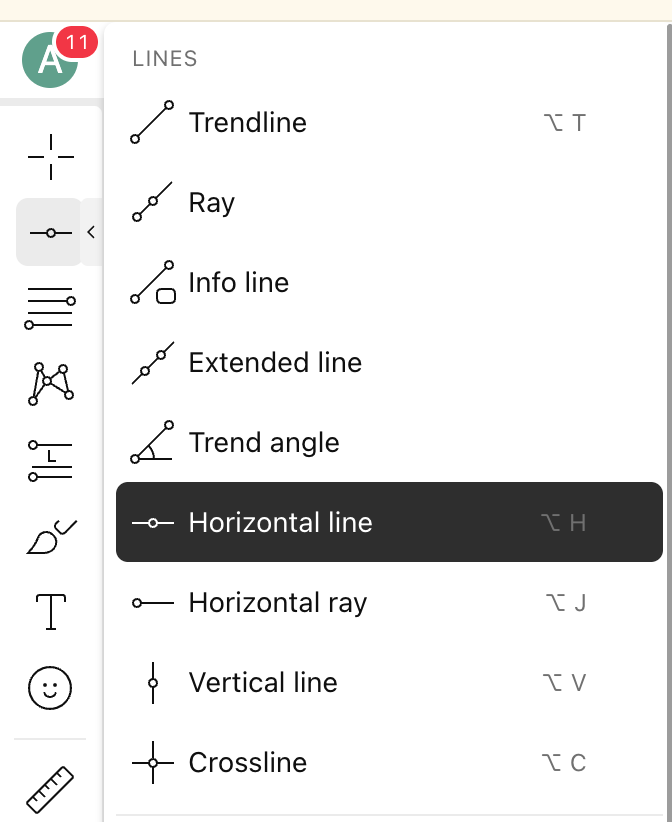
Use the left toolbar to select a tool such as Trend Line or Horizontal Line. Click the chart to place the required anchor points.
For example, you might use a horizontal line to mark a price level you intend to reassess later. The significance and placement of that level depend on your analysis.
Step 2: Edit and organise drawings
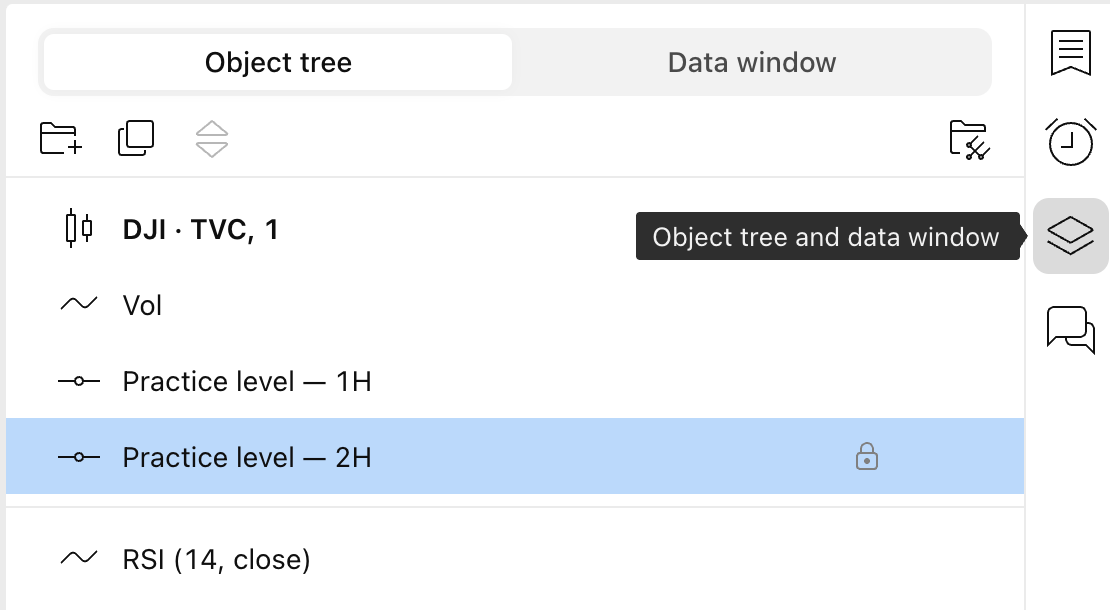
Select a drawing to change its colour, label, coordinates, or visibility. Use Object Tree and Data Window to find, rename, hide, lock, or remove objects on a busy chart.
Use descriptive names such as Practice level — 1H rather than generic object names. Lock completed drawings when appropriate to reduce accidental repositioning.
Clear labels also make it easier to identify which chart condition an alert refers to later in the workflow.
3. Creating TradingView alerts for chart conditions
TradingView alerts let you monitor supported conditions without continuously watching the chart. An alert tells you that its configured condition has been met; it does not tell you whether to trade.
Step 1: Choose the alert condition
TradingView Basic includes up to three active price alerts. Technical alerts based on indicators, strategies, or drawings require a paid plan. For this walkthrough on Basic, choose a price alert.
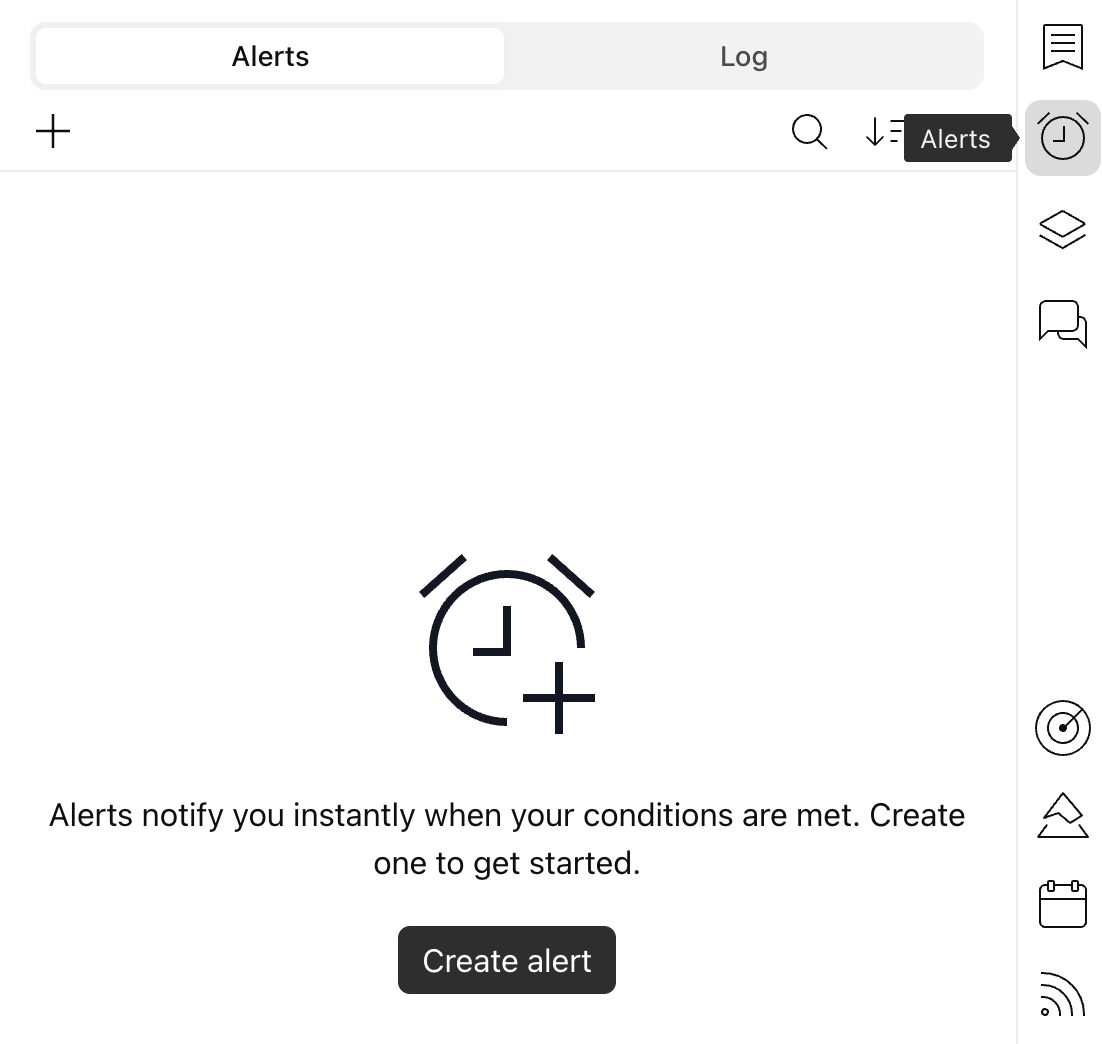
Select Alert on the chart toolbar, or right-click a supported price level, drawing, or indicator and choose the available alert option.
In Condition, choose the symbol or supported technical condition you want to monitor. Depending on the feature and configuration, alerts can monitor conditions based on price, indicators, drawings, or supported Pine Script logic.
Step 2: Set the trigger and notification
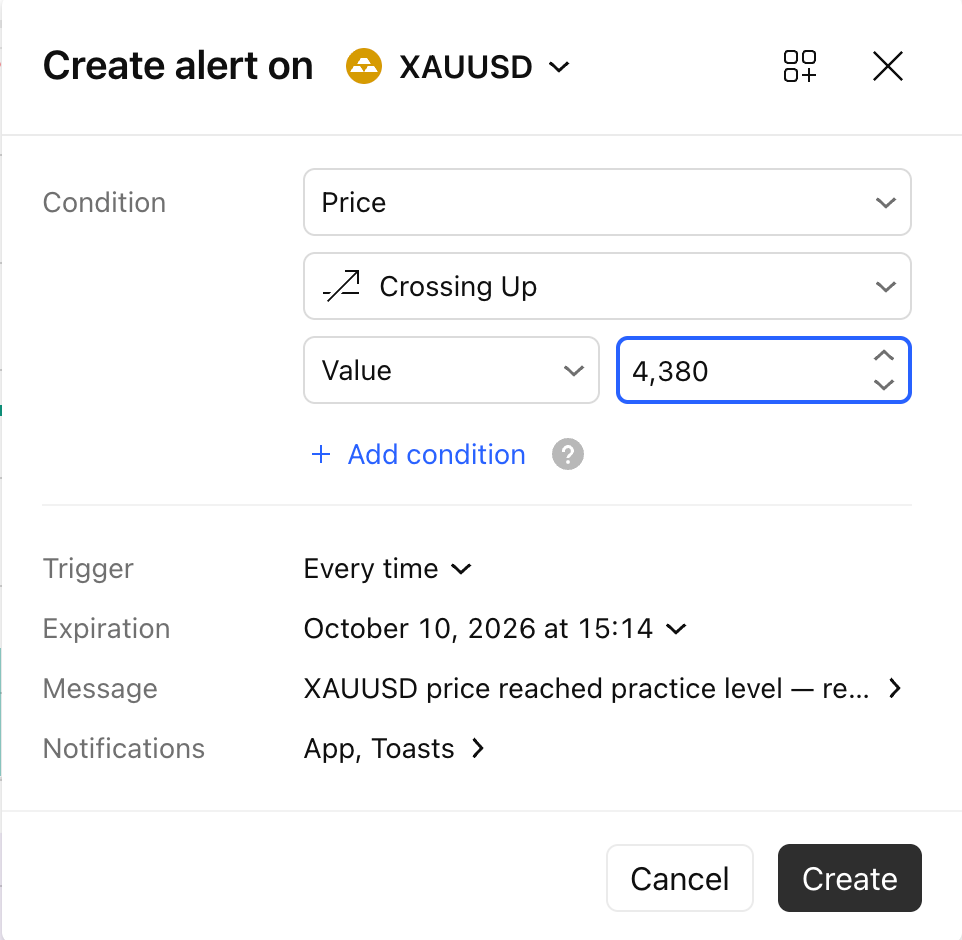
Choose the relevant operator, value, trigger frequency, expiry, and available notification method.
Add a message that reminds you why the alert exists. For example:
Price reached practice level — reassess the chart; do not enter automatically.
Review the alert summary before creating it. When the condition is met, return to the chart and reassess it rather than treating the notification as an automatic trading signal.
Step 3: Manage existing alerts
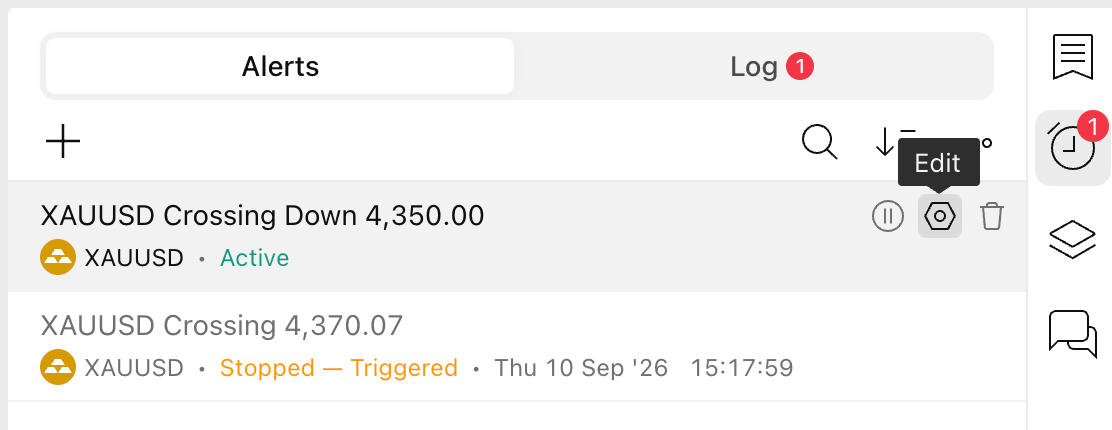
Open Alerts on the right toolbar to review, pause, edit, restart, or remove alerts.
An existing indicator alert keeps the settings used when it was created. Changing the indicator on your chart does not update that alert. Delete the old alert and create a new one to use the changed settings.
4. Saving a reusable TradingView chart layout
A saved chart layout helps you return to a consistent analysis setup instead of rebuilding the workspace for every review.
Step 1: Create and name the layout
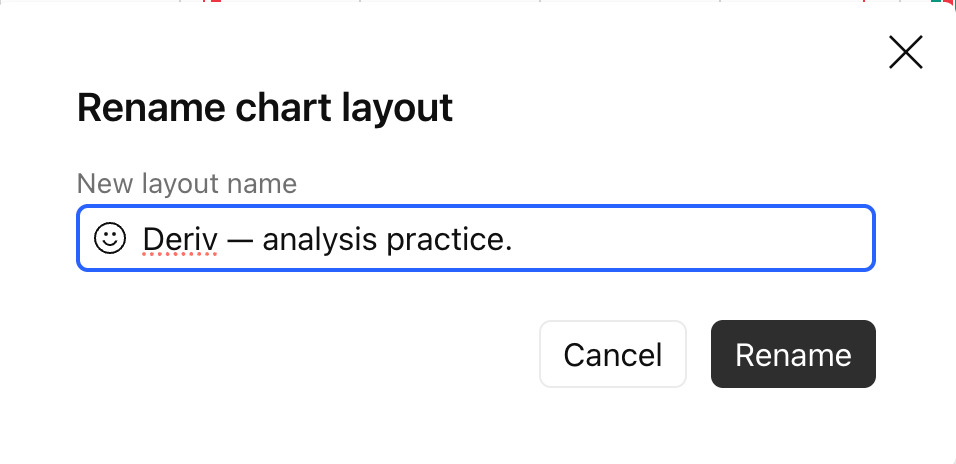
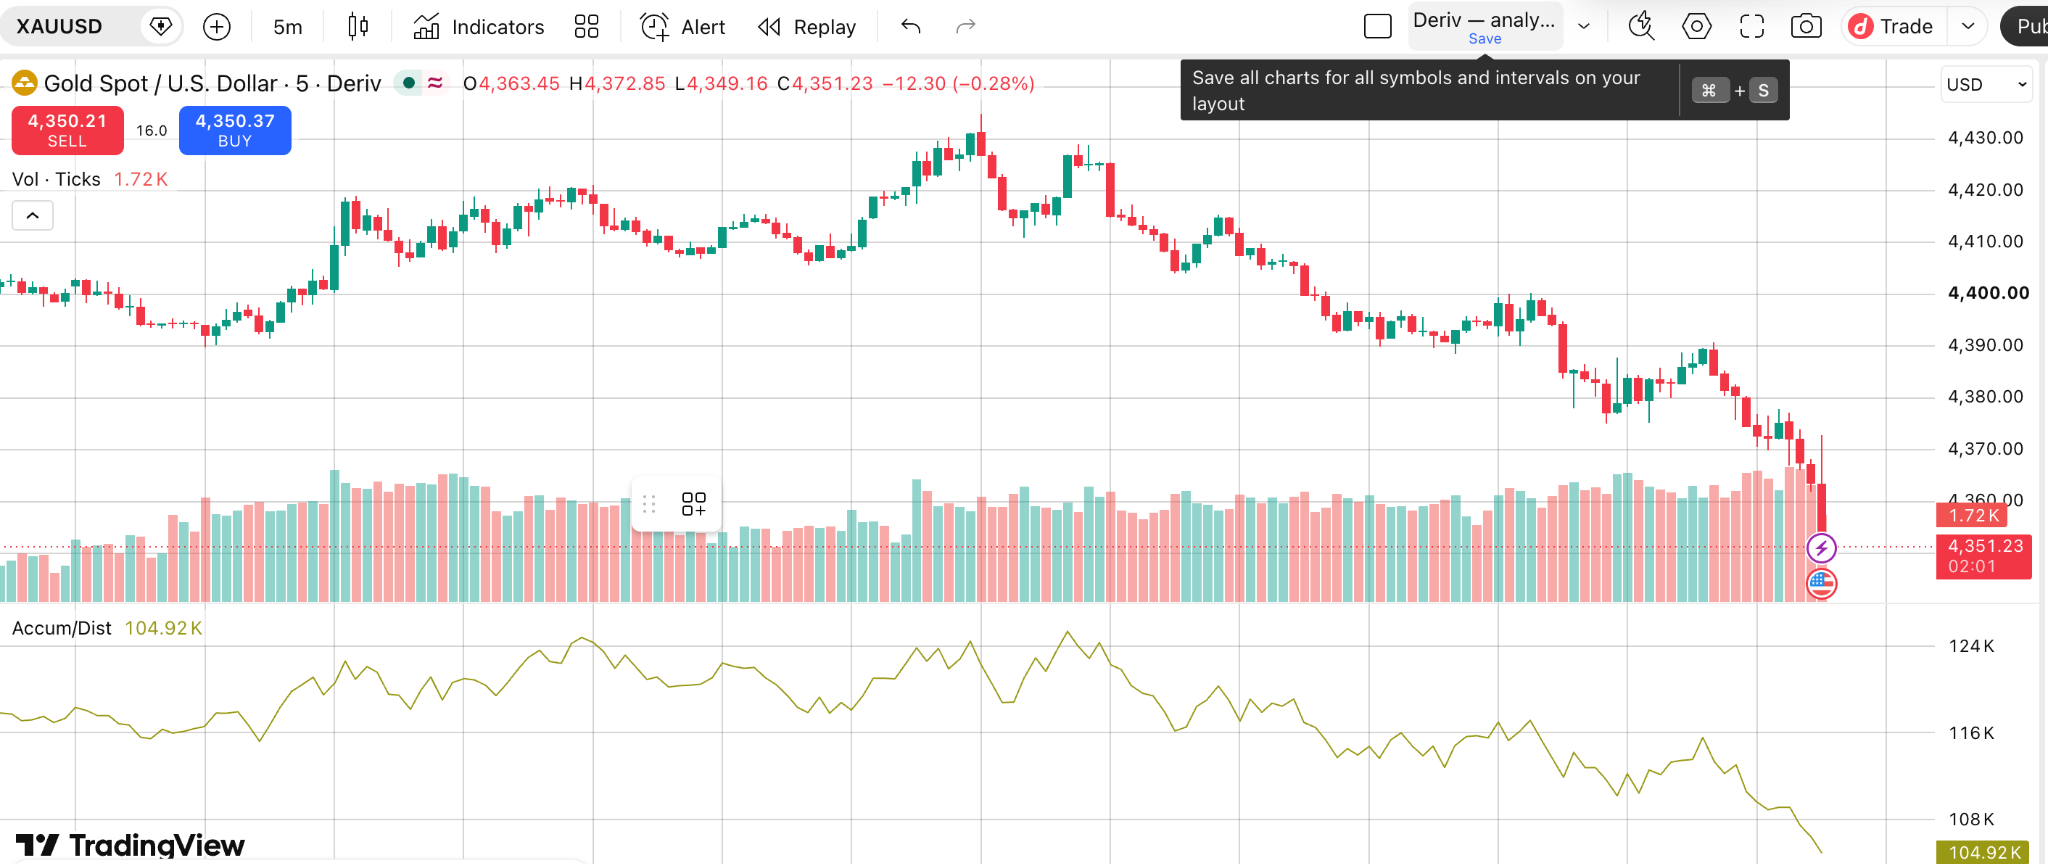
Open Manage layouts. Rename and save your existing layout, or create another if your plan supports it. TradingView Basic allows one saved layout. You could name it Deriv - analysis practice.
Layouts can retain chart configuration such as symbols, timeframes, appearance, indicators, and drawings, subject to the relevant TradingView settings and feature behaviour.
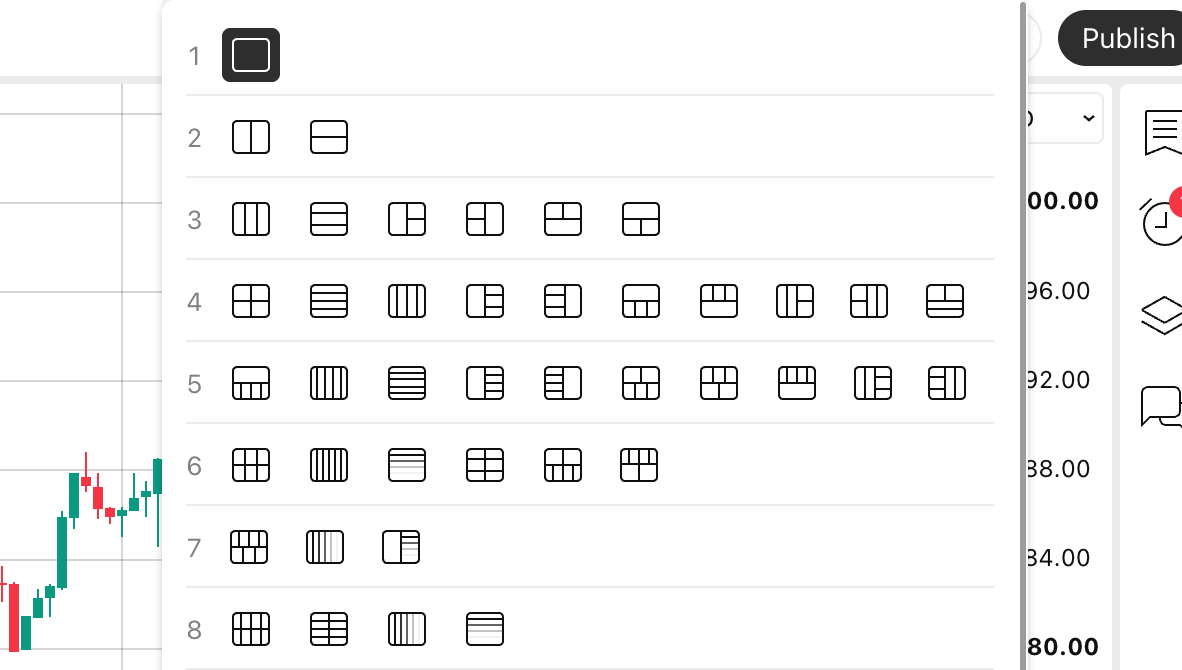
Step 2: Choose one or more charts
Open Layout setup and choose an arrangement available on your plan. Basic allows one chart per tab. Paid plans support multiple charts, with limits depending on the plan.
If you use a multi-chart layout, decide which supported elements should be synchronised across charts. These may include symbols, intervals, crosshairs, time, or drawings, depending on your configuration.
Give each chart a clear purpose. For example, one chart could provide higher-timeframe context while another shows lower-timeframe detail.
Step 3: Save your changes
Select Save or use Autosave according to your preference and available settings.
Before changing layouts or devices, check that the version you want to keep has been saved. This helps preserve the setup you use when moving from instrument selection to chart analysis and alerts.
5. Practising chart analysis with Bar Replay
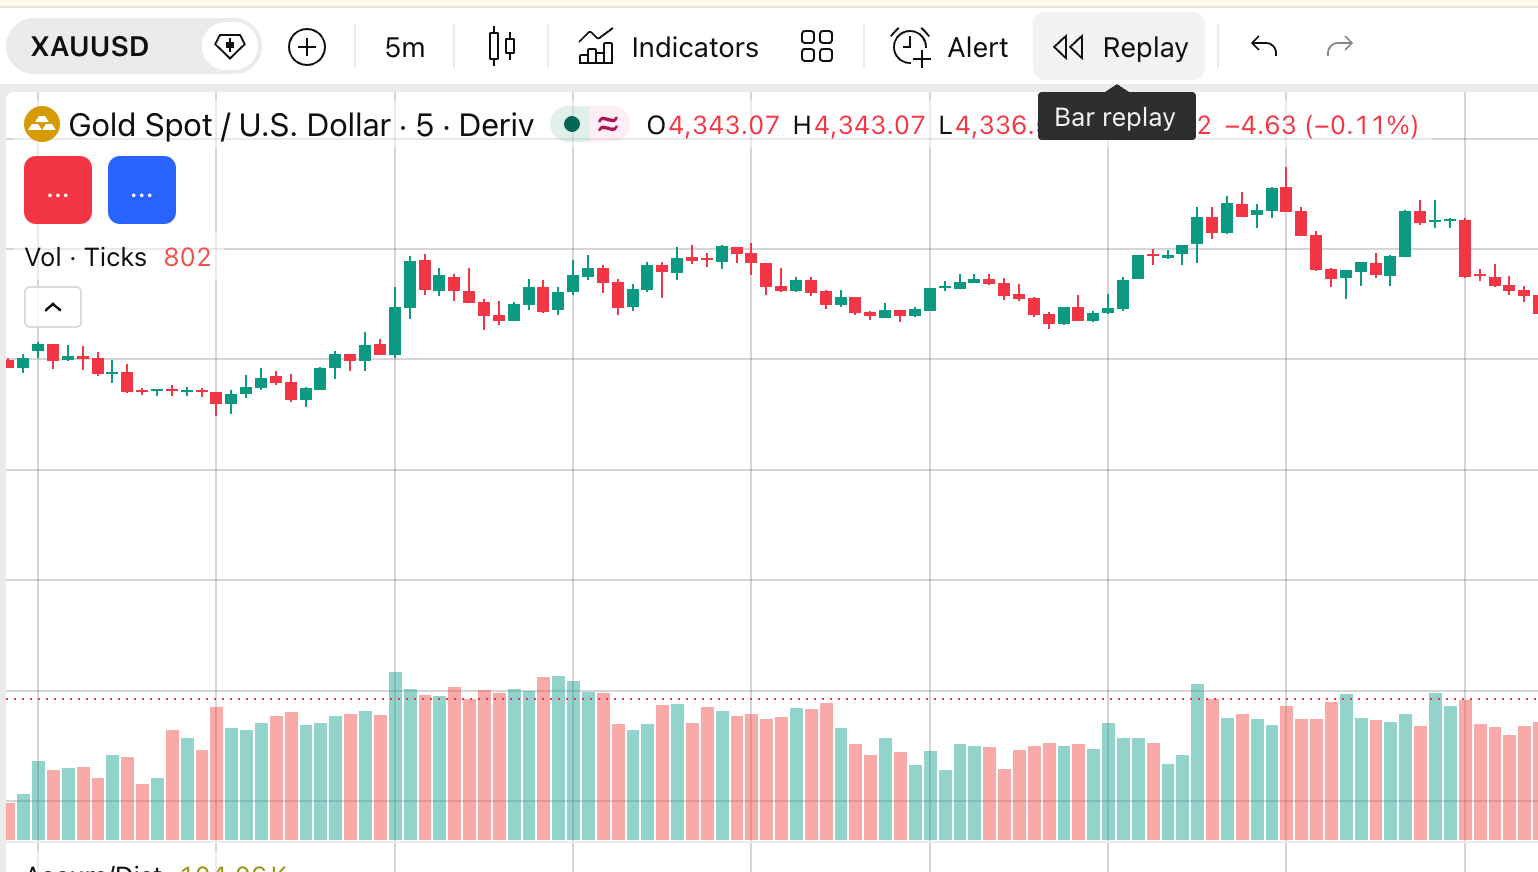
Bar Replay lets you move back to an earlier point on a chart and reveal subsequent bars progressively. This can help you practise applying the same analysis questions without initially seeing what happened next.
Step 1: Start Bar Replay
On TradingView Basic, use a daily or higher timeframe for Bar Replay. Replaying minute-based data requires a paid plan. Available history also depends on the instrument.
Bar Replay changes the historical chart you see. Orders placed through a connected broker or ordinary Paper Trading still use real-time prices. To practise trading at replay prices, use the separate Replay Trading feature where available.
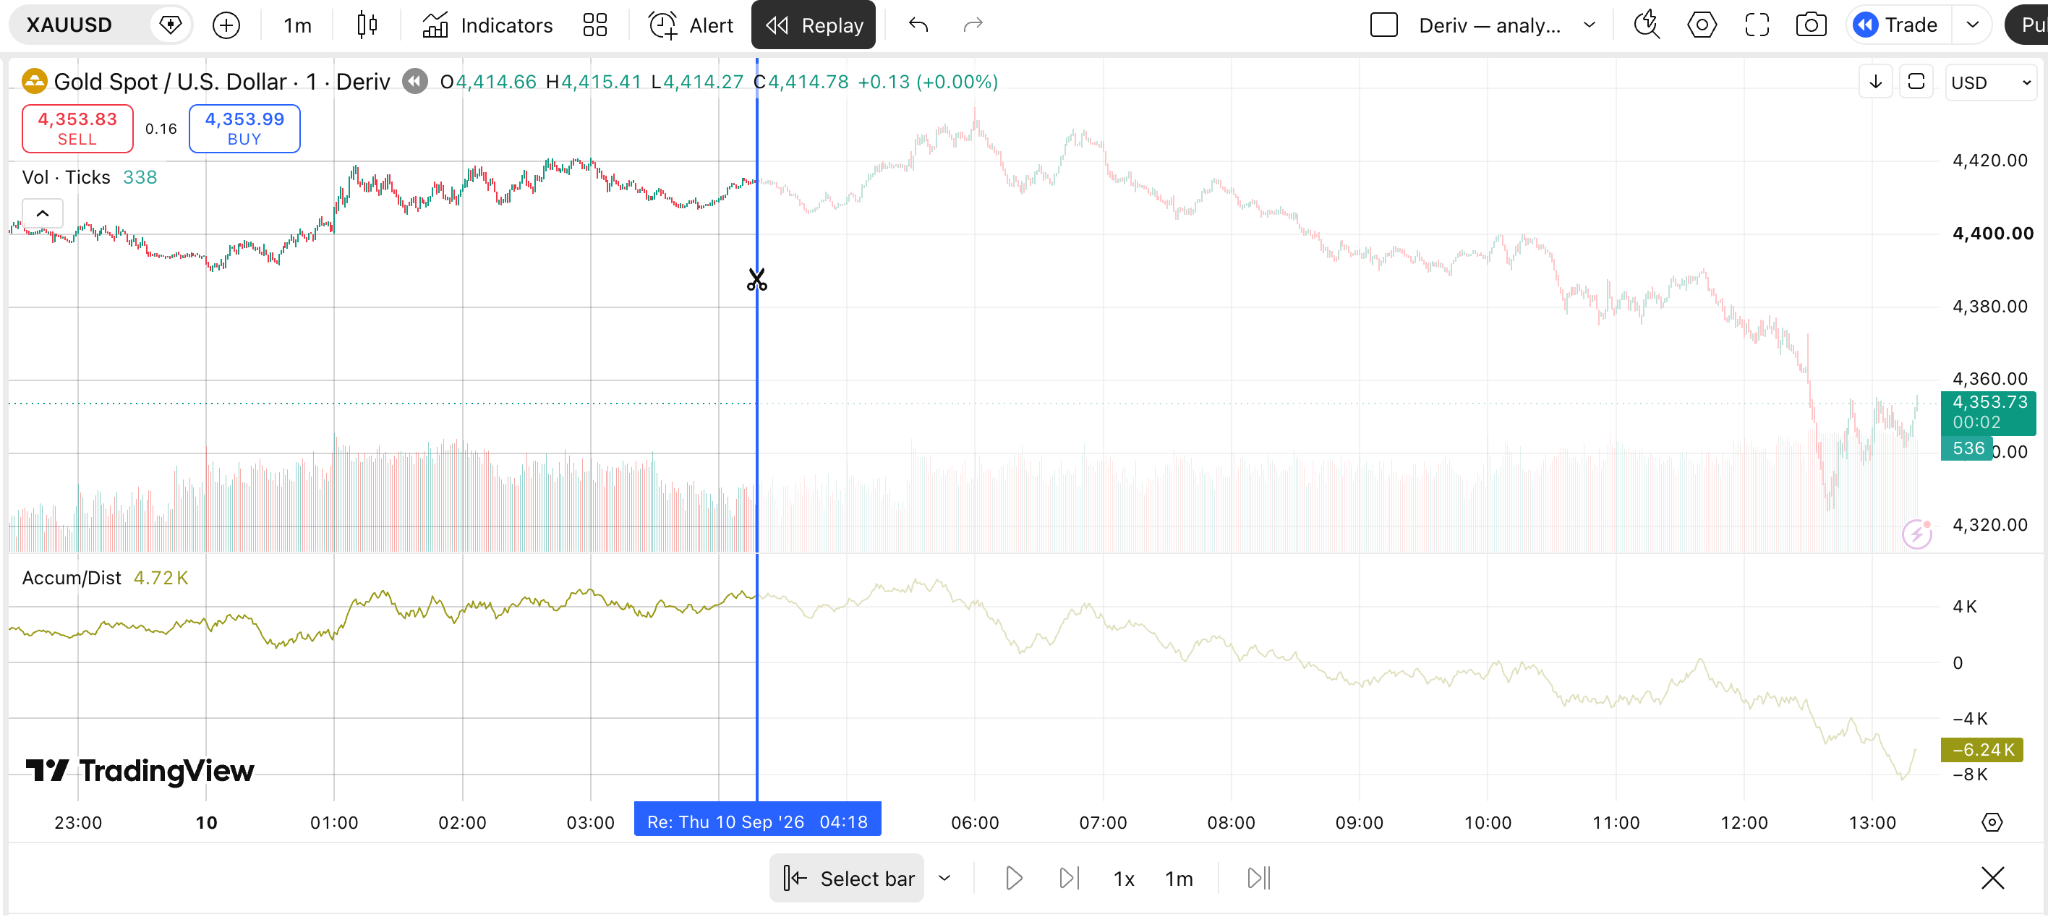
Select Bar Replay on the top panel. Move the vertical selection line to a historical point, then click the chart to choose the starting bar.
Before continuing, apply the same process you would normally use: identify the context, review relevant levels, and note what you would monitor next.
Step 2: Play or step through the chart
Use Play to reveal bars automatically, adjust the replay speed, or use Forward to progress one step at a time.
Pause before revealing the next bar and record what you would check next. You can use relevant drawings and indicators during the exercise to practise a consistent analysis process.
When you finish, use the appropriate control to return the chart to real-time data.
How the five TradingView features work together
Use the features as a repeatable sequence rather than five separate tools:
- Choose: Select a Deriv instrument from your focused watchlist.
- Prepare: Open the saved chart layout you use for analysis.
- Analyse: Add only the drawings needed to mark relevant chart areas.
- Monitor: Create an alert for a supported condition you want to reassess.
- Practise: Use Bar Replay separately to practise reading historical chart conditions.
- Review: Save your changes and notes before moving to another instrument.
This creates a consistent process from instrument selection through chart preparation, monitoring, practice, and review.
What to remember when using TradingView with Deriv
- Watchlists organise the instruments you monitor; they do not rank trading opportunities automatically.
- Drawing tools represent your analysis and should not be treated as objective trading signals.
- Alerts tell you when configured conditions are met; they do not guarantee an entry, execution, or outcome.
- Save layouts after making changes you want to retain.
- Keep Bar Replay practice separate from live broker execution.
- TradingView plan limits can affect access to charts, alerts, indicators, layouts, and other functionality.
- Verify current TradingView and Deriv feature availability when a workflow depends on a particular function.
Quiz
FAQs