
Deriv's Derived Indices come in many types: Volatility, Crash & Boom, Crash Boom Flip, Jump, Step (and its variants), Trek, Tactical, Exponential Growth, and Volatility Switch Index. Each one is built from its own math model, and each one looks different on a chart. This guide won't teach you everything about any single index. It's a quick way to tell them apart, with links if you want to learn more about one.
Quick summary
- Every Derived Index has a shape you can learn to spot.
- The number in an index's name usually tells you how big or how fast its moves are. Not which direction it will go, or how safe it is.
- These markets never stop. No weekend gaps, no opening or closing times.
- Use the table below to look up a shape, then click the links to learn more about that index.
Shape lookup table
Key takeaway: Ten shapes sounds like a lot to remember. But most of them fall into just a few types. Once you can spot "climb-then-drop," "staircase," and "flat and noisy," you already know most of what you need.
Why the number in the name matters
In several of these families, the number in the name tells you about size or speed, not direction:
- On Volatility Indices, a bigger number (say, Volatility 100 vs Volatility 10) means bigger price swings over a similar stretch of time.
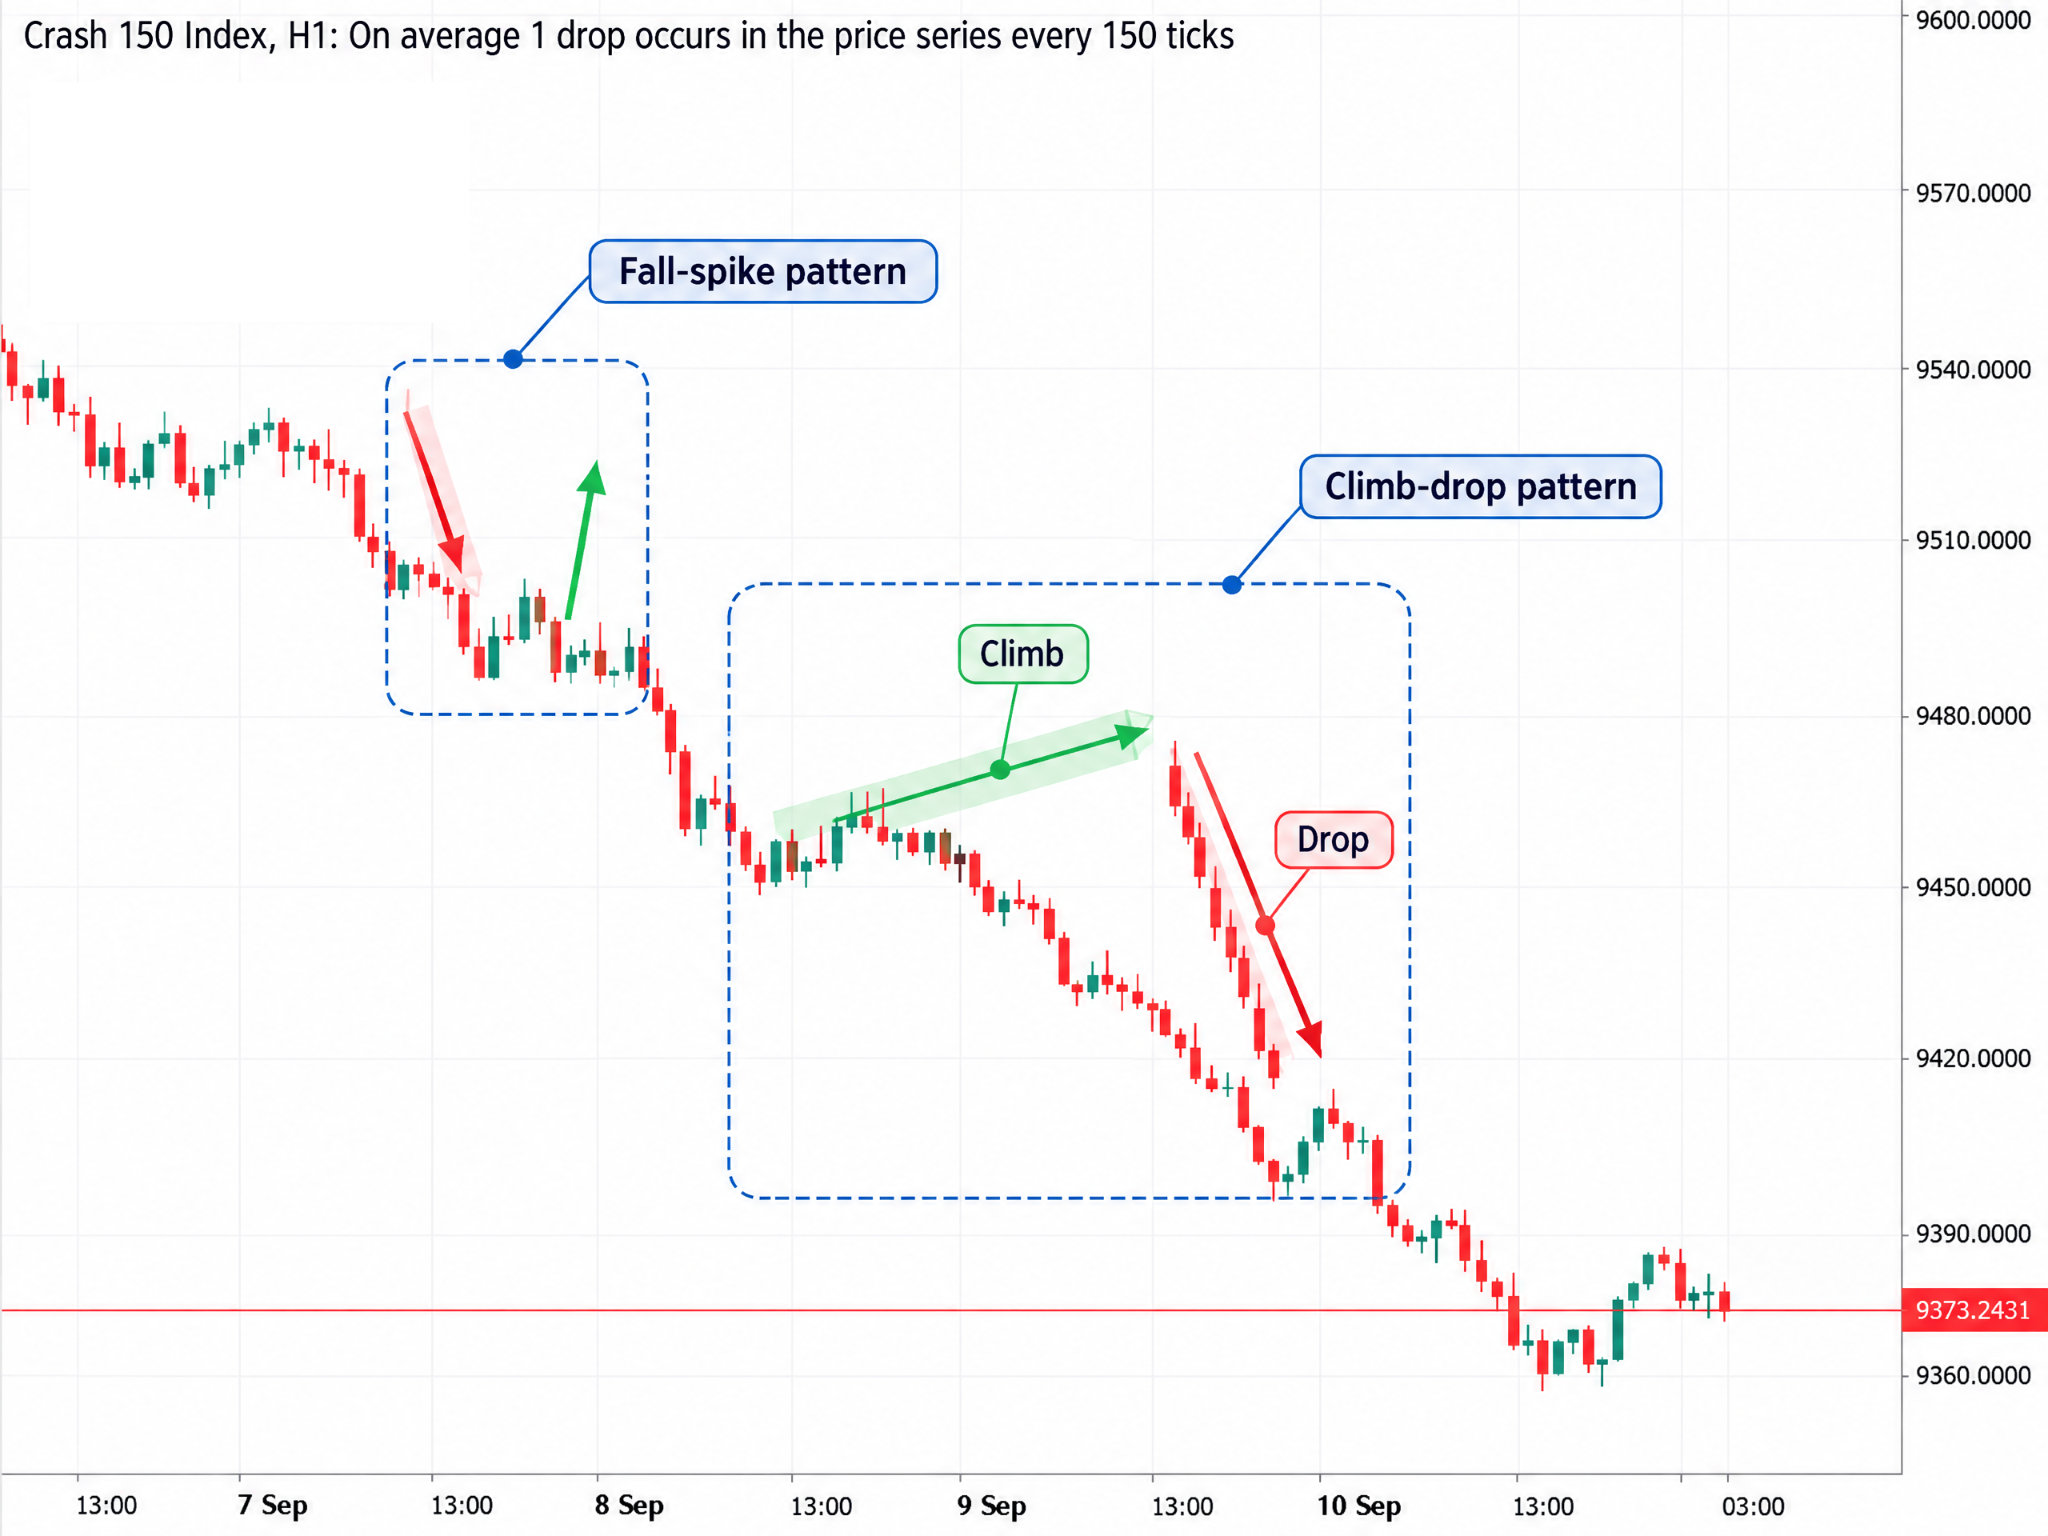
- On Crash, Boom, and Flip Indices, the number tells you the average number of ticks between sharp moves. Crash 150 has sharp moves more often, and they're usually smaller. Crash 1000 has them less often, but they're usually bigger.
A higher or lower number isn't "better.” It just changes what you're looking at. Always check which exact index you're on before comparing charts.
These markets never close
Derived Indices come from a math model, not from real people trading on a real exchange. That means there's no opening bell, no closing bell, and no weekend gap. You can check this yourself: open a chart for any Derived Index and scroll back to a weekend. Unlike a forex or stock chart, the price just keeps going. No gap.
This is also why tools built around trading sessions, like opening range or session Volume-Weighted Average Price (VWAP), don't work here. There's no session for them to measure.
How to use this guide in practice
1. From your Deriv dashboard, select CFDs from the left-hand menu, then click Trade on your chosen account (e.g. your MT5 CFDs account) to open its chart. Alternatively, view Derived Indices through a linked TradingView account.
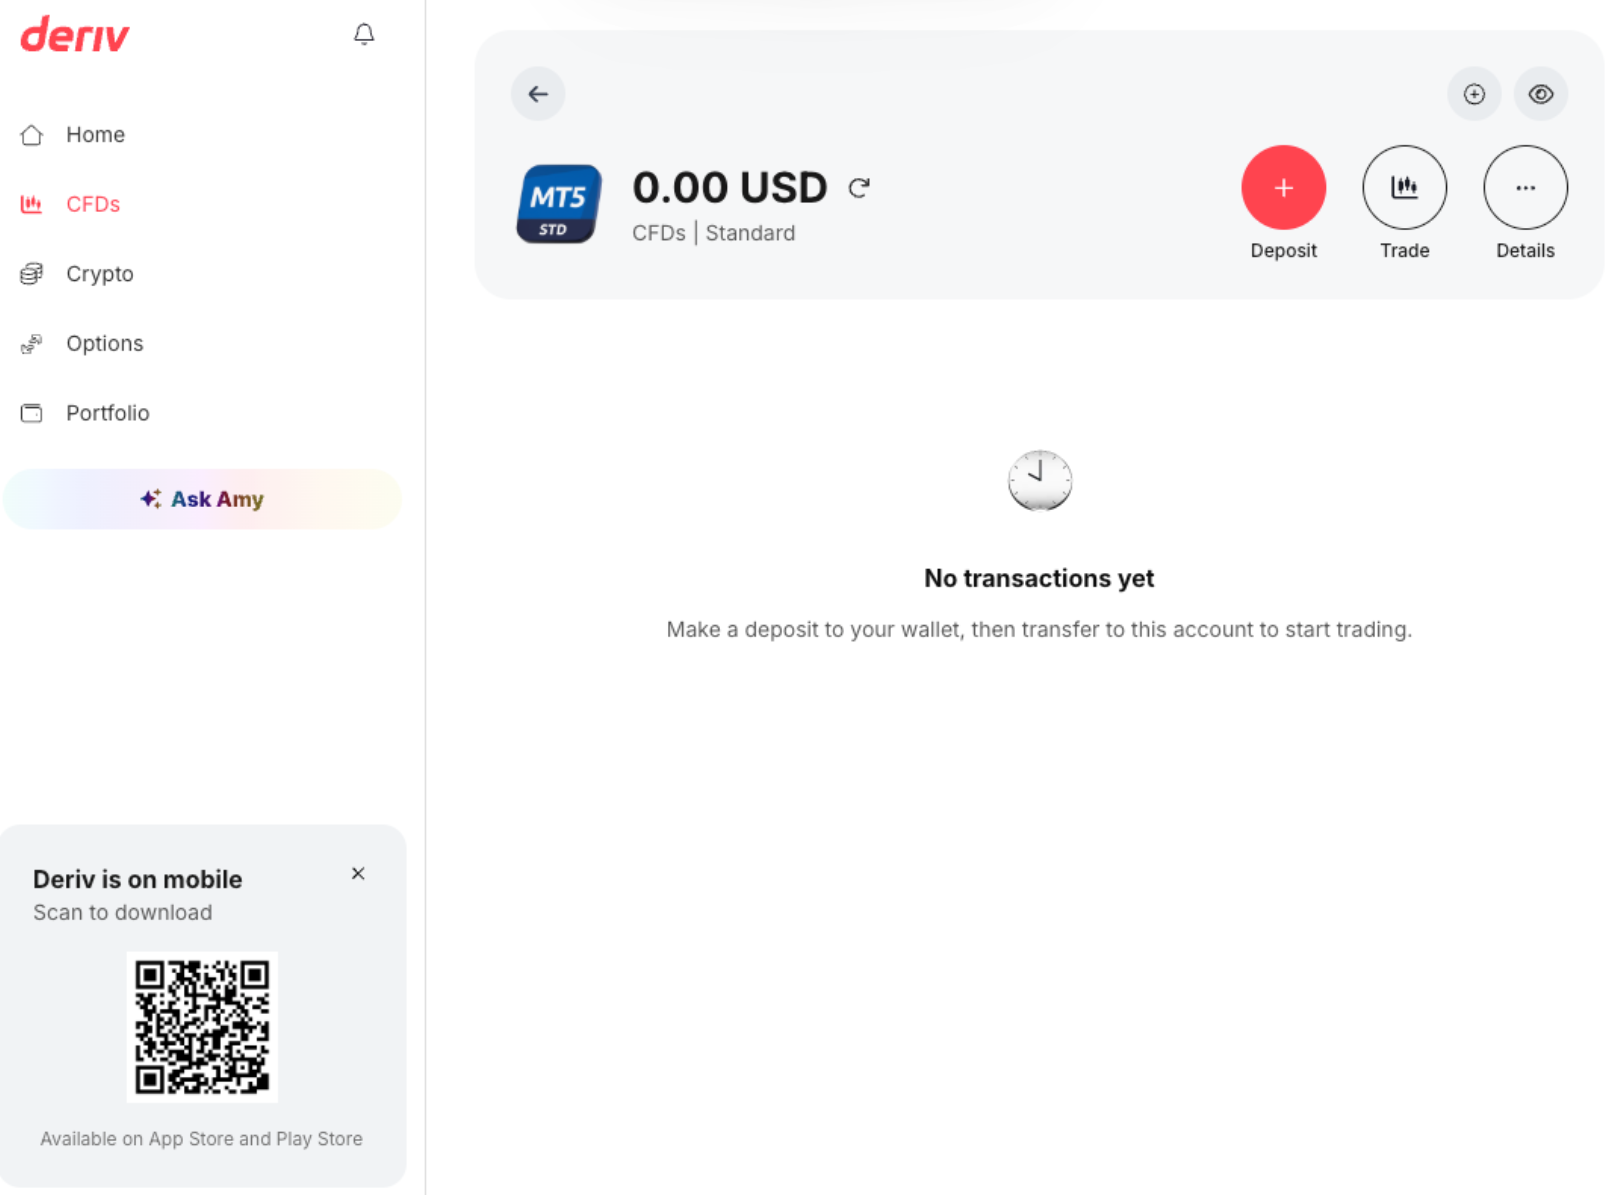
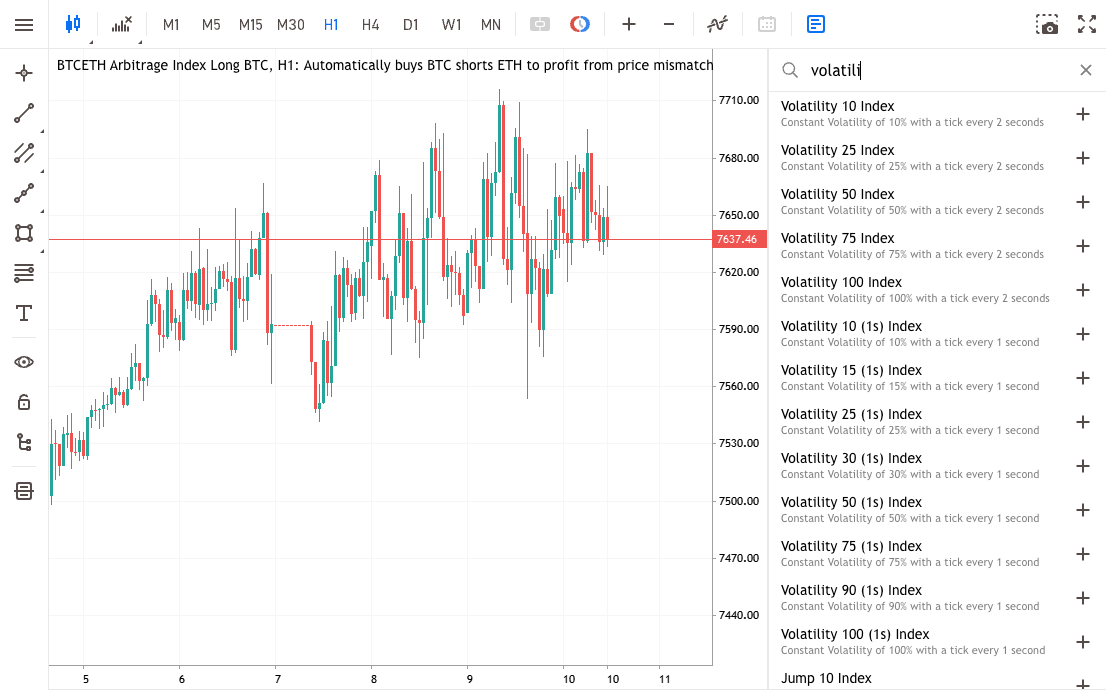
2. Use the table above to spot which family you're looking at, just from its shape.
3. Zoom out. On a Crash/Boom/Flip chart, you'll see the climb-drop or fall-spike pattern.
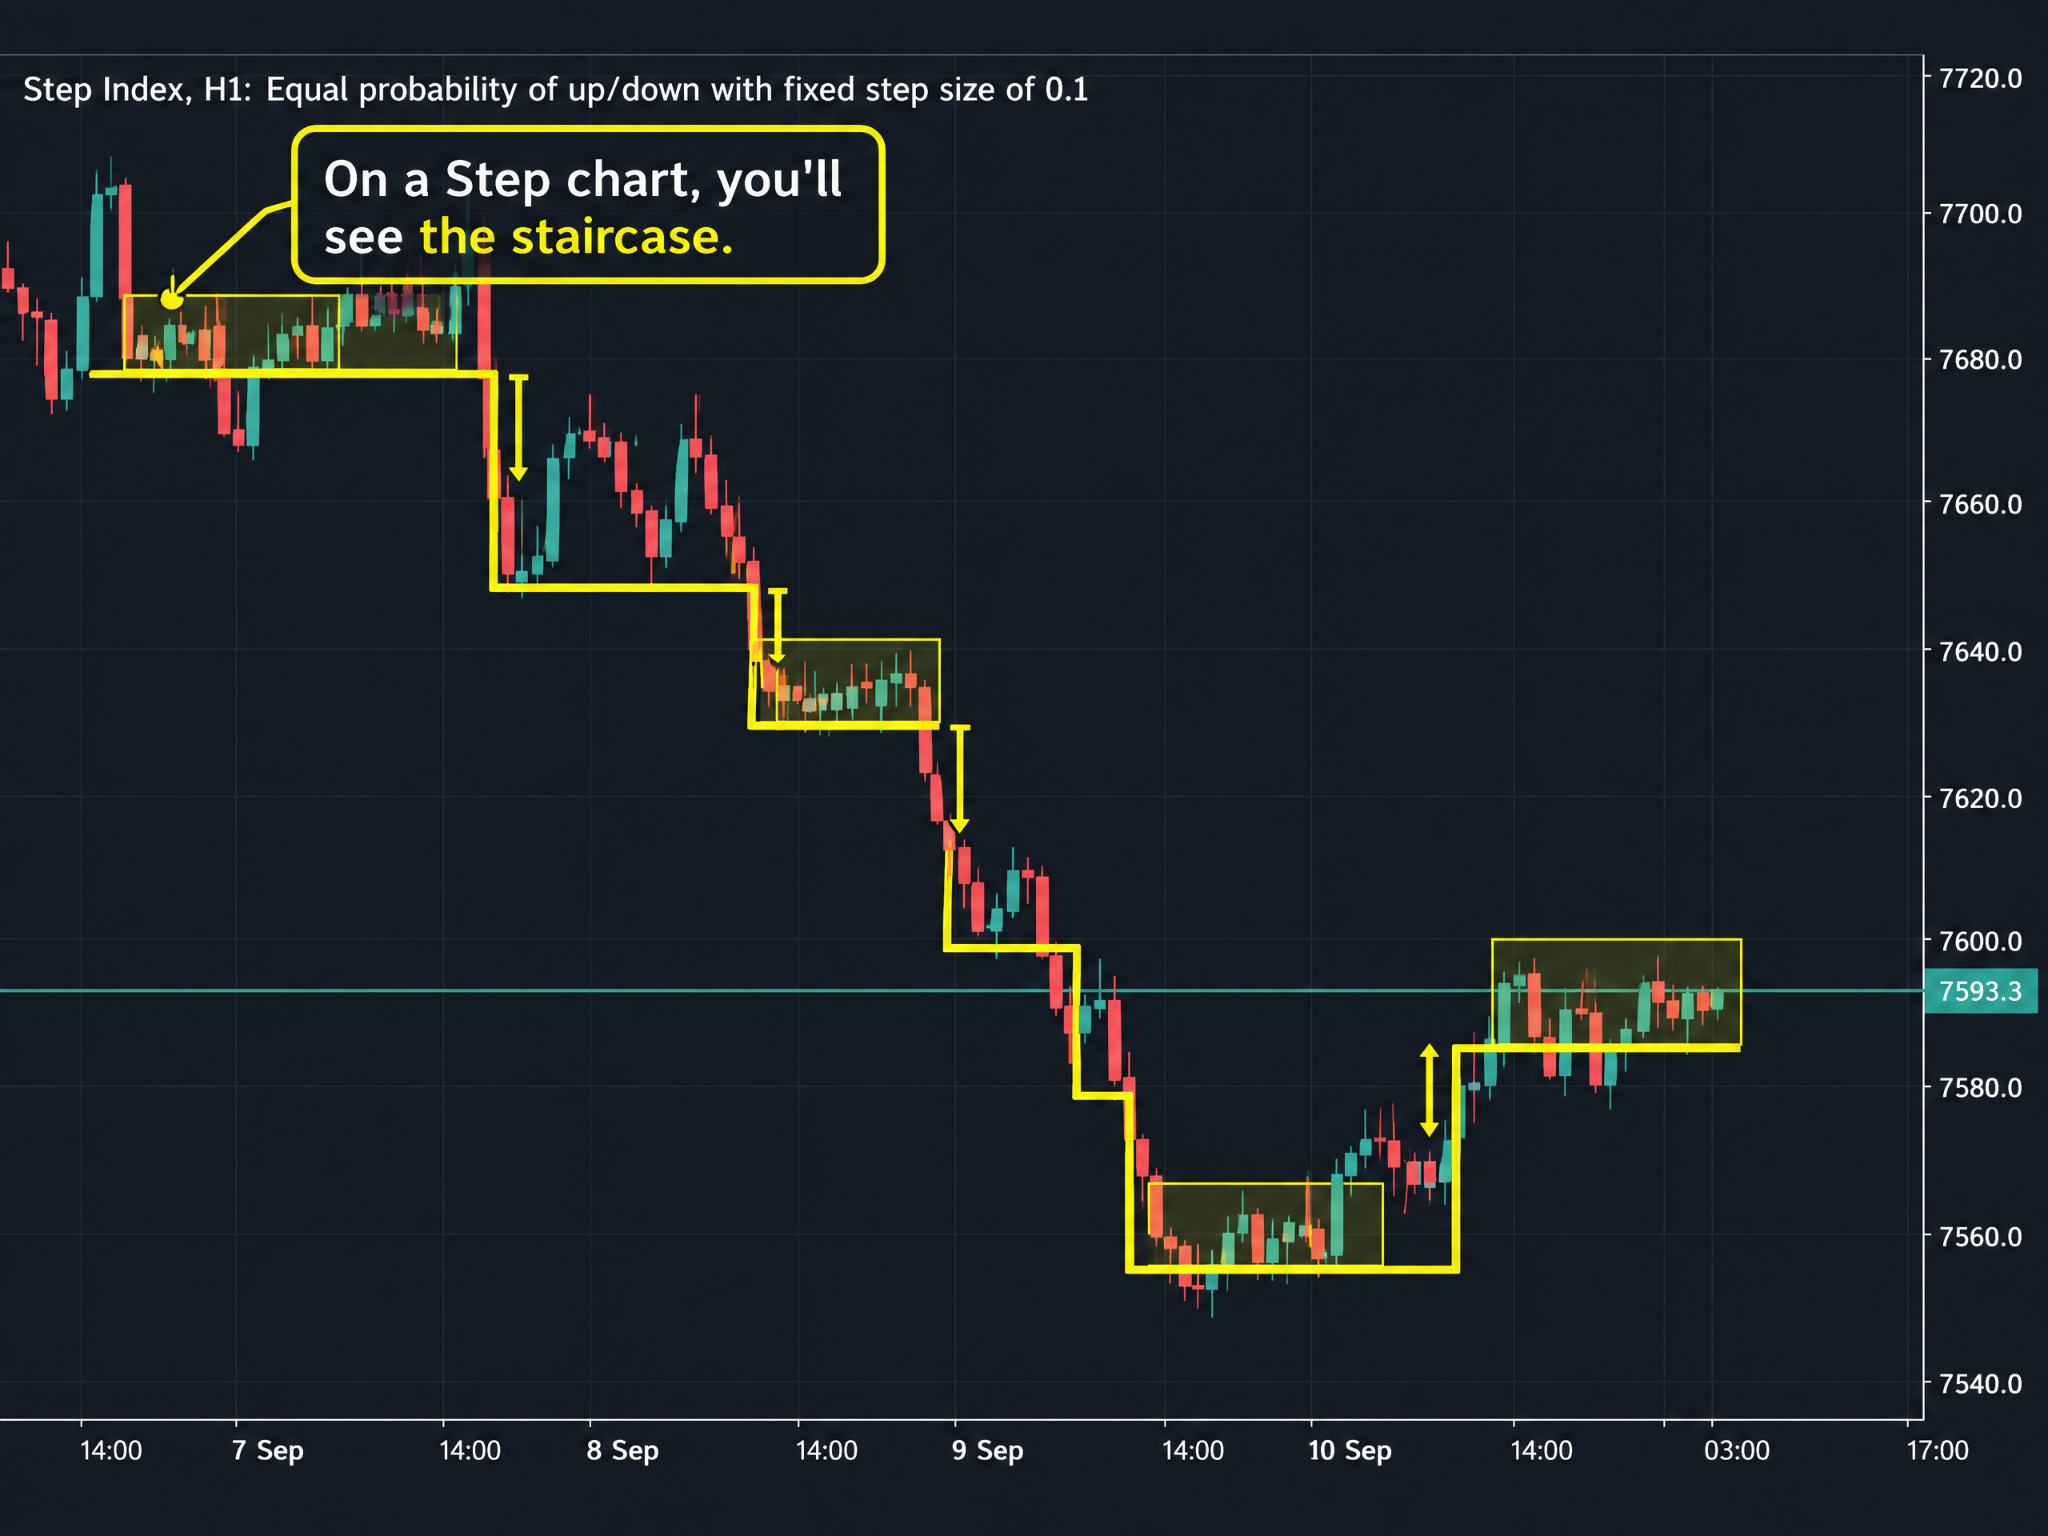
In contrast, a Step Index chart displays clear, distinct stair-step levels:
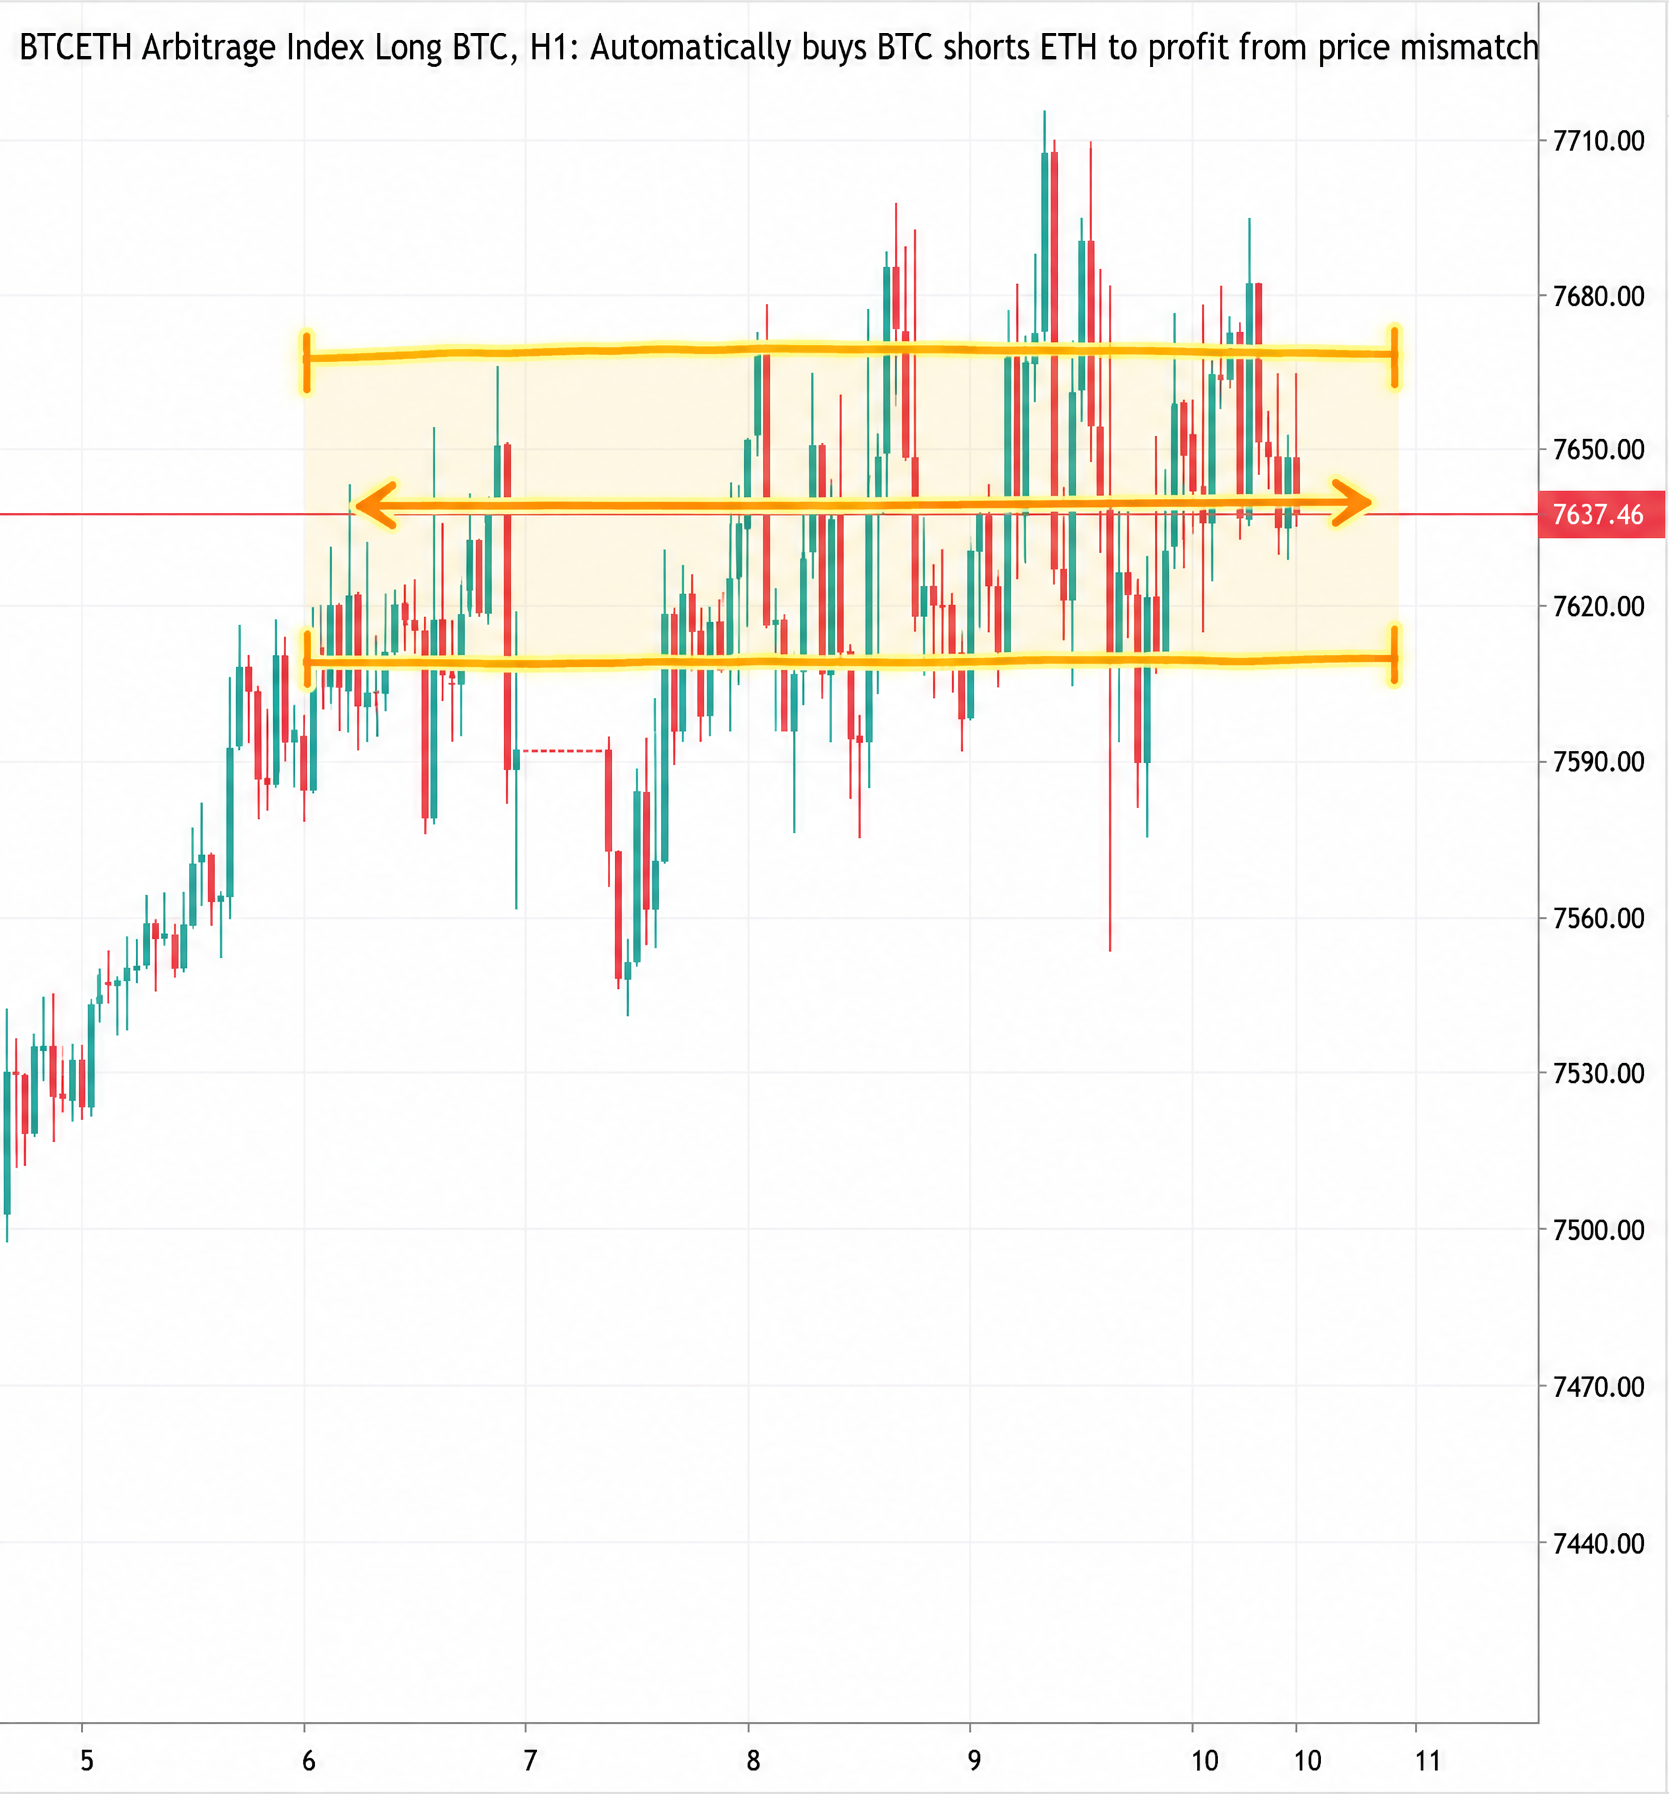
Meanwhile, a Volatility Index chart oscillates around a central channel with steady noise:
4. Once you know the family, follow the linked guide for that index to learn how it really works before you trade it.
Where to go deeper
This guide is a starting point, not a replacement for the full guide on whichever index you're trading:
- For Crash, Boom, and Flip Indices, see what a Crash Boom Flip Index is and how it works, and the comparison of Flip versus classic Crash and Boom Indices.
- For Step Indices and their variants, see the guide to how Step Indices evolved (Step, Multi Step, Skew Step), and the dedicated guide to Skew Step Indices.
- For Volatility Indices, see the full guide to understanding Volatility Indices.
Closing thoughts
The Derived Indices family is big, but each member has a shape you can learn to recognise at a glance. This guide helps you quickly figure out which family a chart belongs to. The real depth, such as how each one works, its variants, and how to trade it, lives in the linked guides above. A demo account is still the easiest way to get familiar with each shape before you trade for real.
Quiz
FAQs


