Crash & Boom indices are some of the most widely traded synthetic markets on Deriv, designed to deliver single-direction price spikes volatility indices or downturns at regular intervals. These indices provide traders with a unique environment to develop strategies that are independent of traditional financial assets and market news.
With the introduction of Crash 150 and Boom 150, traders now have additional options that offer more frequent price spikes compared to other Crash & Boom indices. This guide explains how Crash 150 and Boom 150 work, what sets them apart, and how they compare to the existing range of Crash & Boom indices available on Deriv.
Quick summary
- Crash & Boom 150 are the newest synthetic indices on Deriv, with uni-directional spikes or downturns occurring, on average, every 150 ticks.
- The number in each index name (e.g., 150, 500, 1000) reflects the average tick interval between crash or boom events.
- These indices offer higher-frequency trading opportunities compared to Crash & Boom 300, 500, 600, 900, and 1000.
- All Crash & Boom indices, including the new 150 series, are unaffected by global markets or news and are available to trade 24/7.
- You can trade Crash & Boom 150 on Deriv MT5 and cTrader
What are the Crash & Boom 150 indices?
Crash 150 and Boom 150 are the latest derived indices developed exclusively for the Deriv platforms. Like all Crash & Boom indices, they simulate a market where distinctive spikes - either sharp drops (crashes) or surges (booms) - occur at mathematically defined intervals. Specifically, with these two new indices, there is, on average, a single crash or boom every 150 ticks.
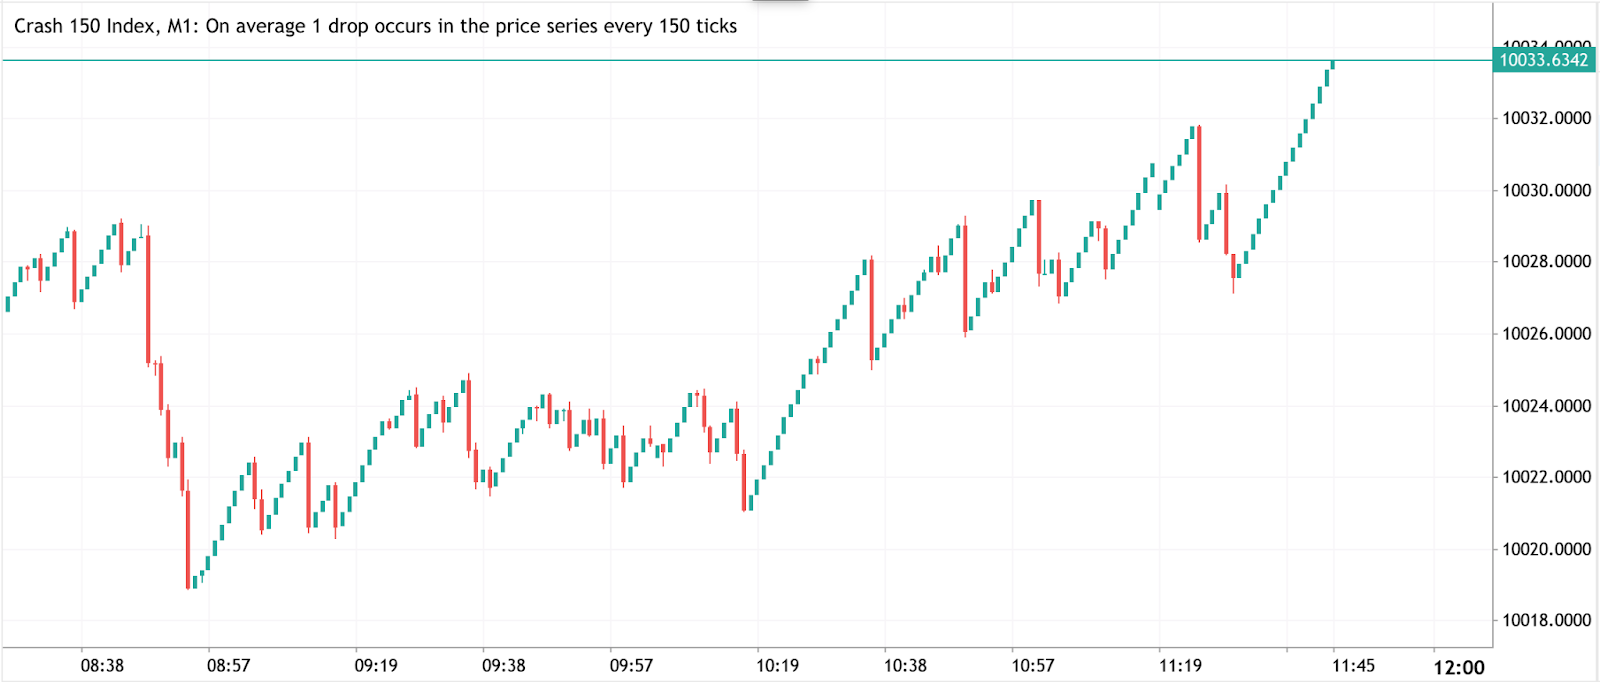
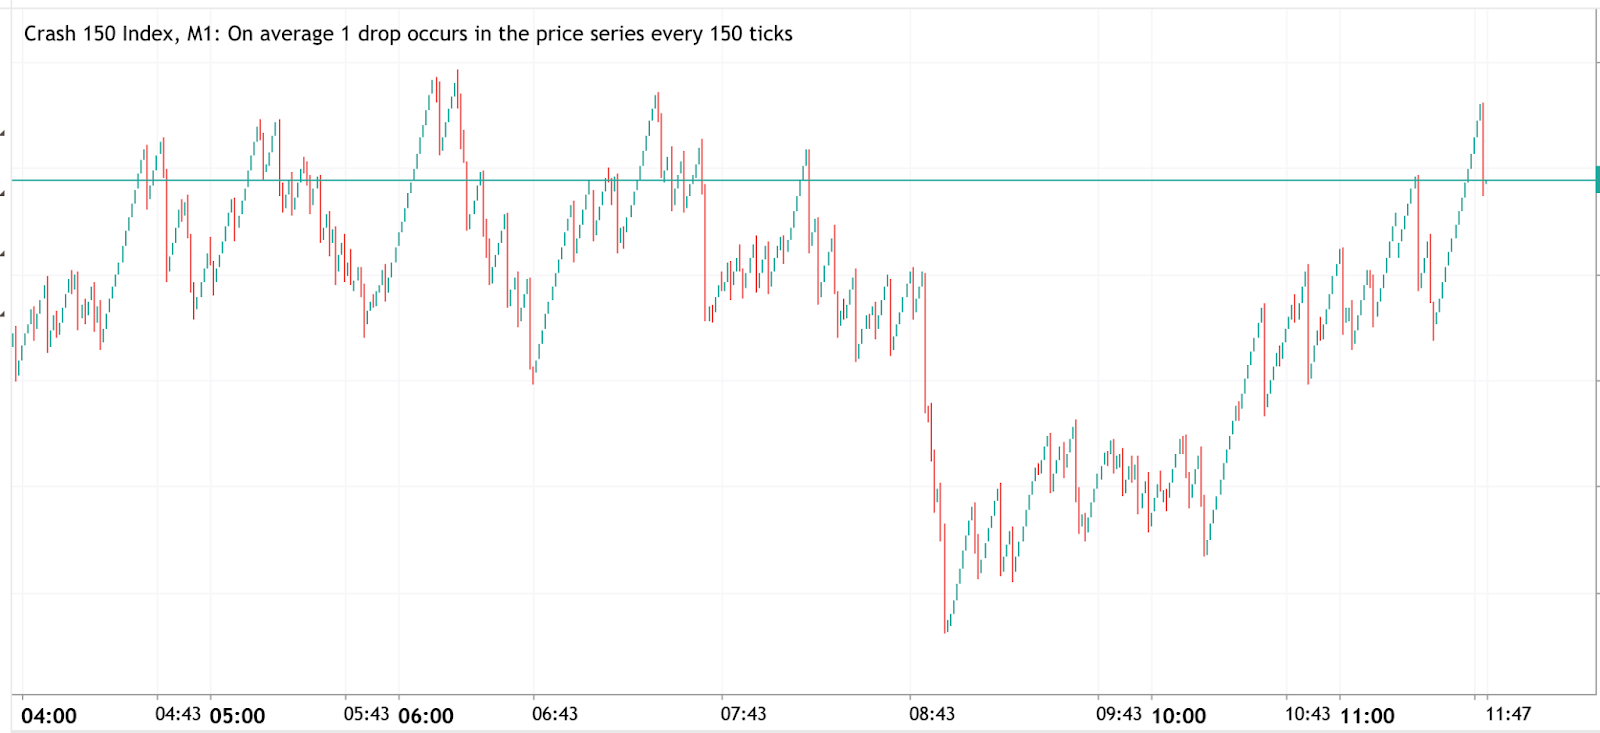
- Crash 150 Index: On average, you’ll see a sharp downward spike (crash) once every 150 ticks.
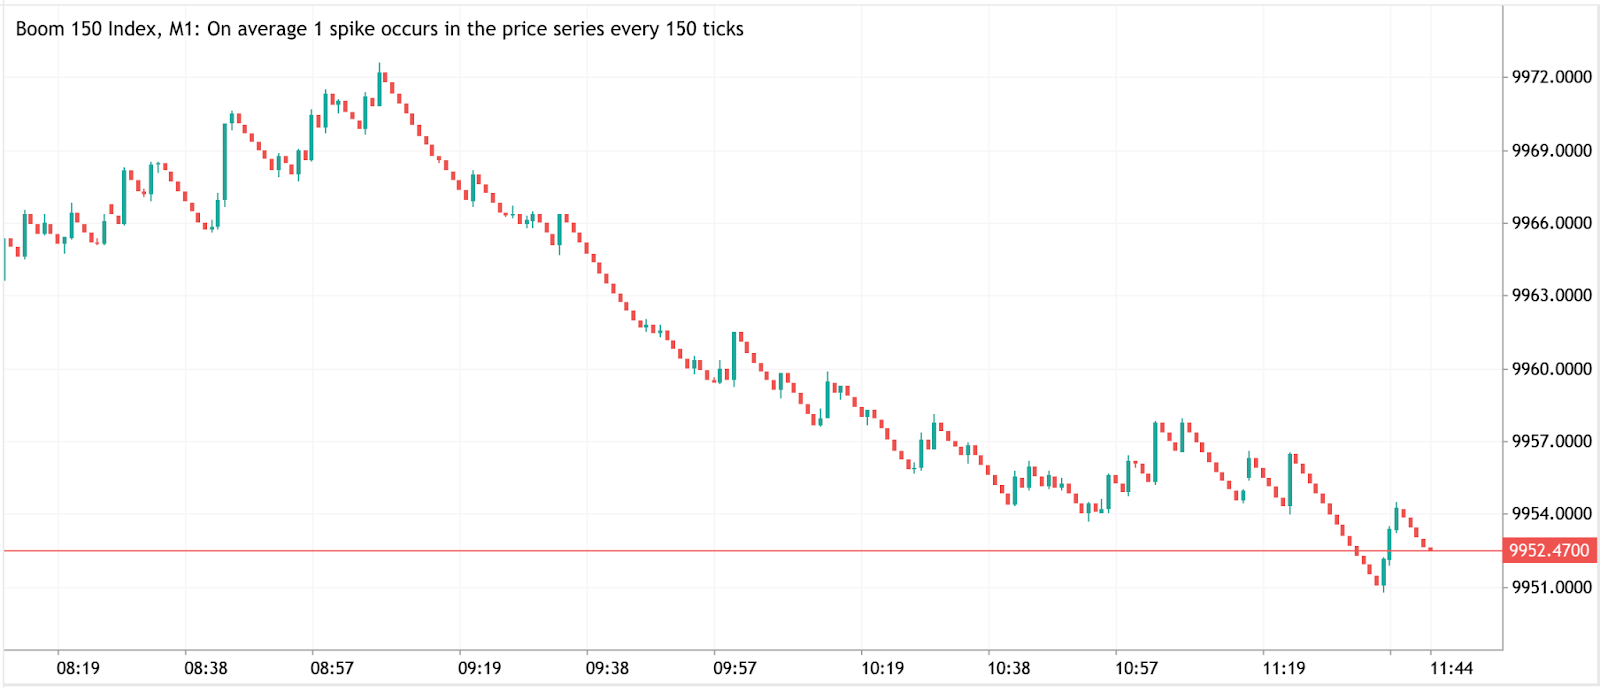
- Boom 150 Index: On average, you can expect a sudden upward spike (boom) once every 150 ticks.
These intervals are engineered and built into the logic of the indices. This means there’s no dependence on news events, macroeconomic changes, or real-world trading hours—you can access these tradable markets whenever you want, day or night.
How do Crash & Boom 150 indices work compared to other Crash & Boom indices?
What distinguishes Crash 150 and Boom 150 is the frequency of their spikes, which is directly reflected in their names. In fact, every Crash & Boom index available on Deriv is named for the average number of ticks between spikes:
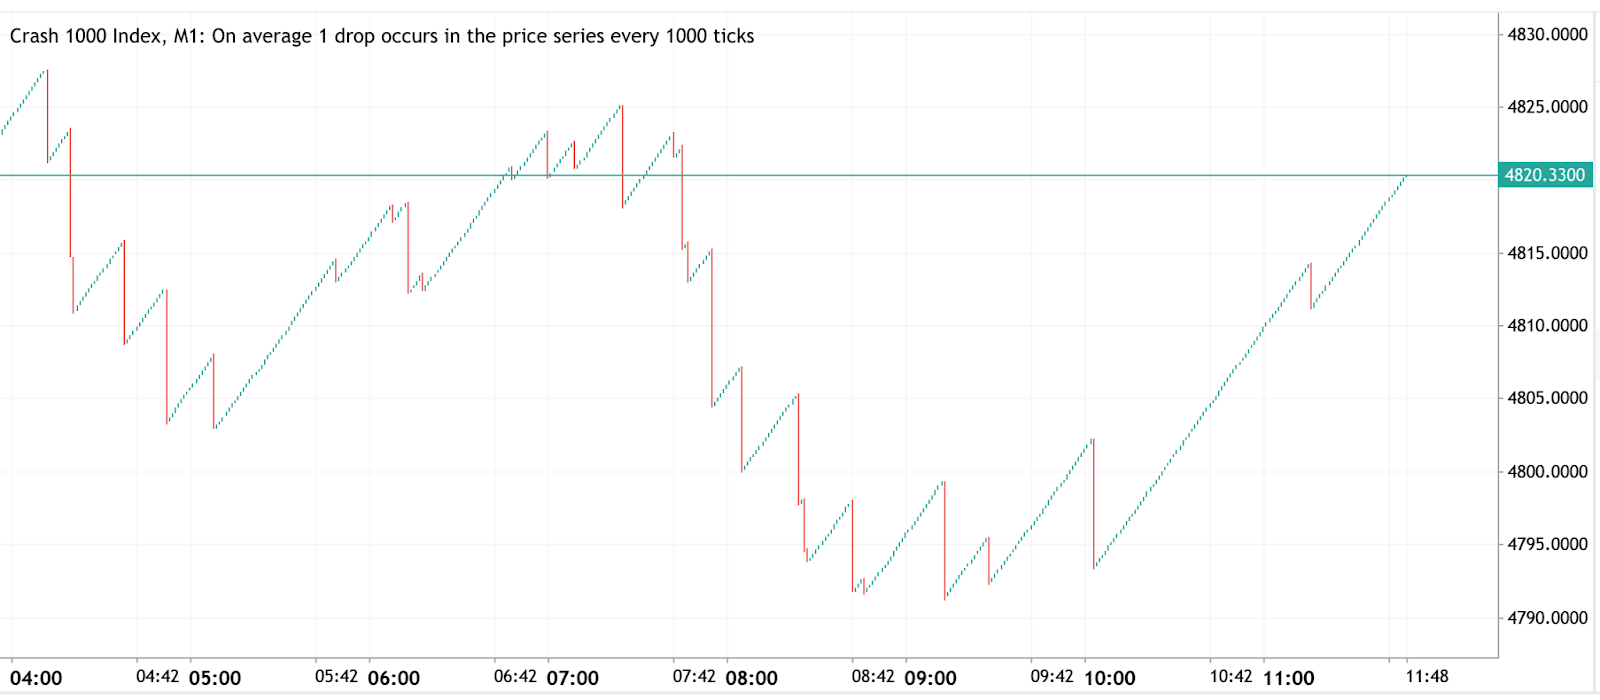
- Crash 1000/900/600/500/300: On average, you’ll see a crash at every 1000, 900, 600, 500, or 300 ticks, respectively.
- Boom 1000/900/600/500/300: On average, you’ll see a boom at every 1000, 900, 600, 500, or 300 ticks, respectively.
- Crash 150 and Boom 150: On average, there’s a spike once every 150 ticks, making them among the most active in the Crash & Boom family.
A lower number in the index means spikes occur more frequently. So, if you enjoy more active trading with frequent opportunities, the 150 series could suit your style. By contrast, higher numbers like 1000 or 900 mean fewer, but often larger, spikes, potentially better for traders seeking bigger market moves but at a slower rhythm.
All Crash & Boom indices maintain the fairness, transparency, and independence from external markets that define Deriv’s synthetic indices.
Trading Crash & Boom 150 indices on Deriv
Trading Crash & Boom 150 indices on Deriv is straightforward and accessible across multiple platforms, including Deriv MT5 (Standard, Swap-Free, and Zero Spread accounts) and cTrader. You’ll find Crash 150 and Boom 150 listed among the other Crash & Boom indices in your asset selection menu.
Crash & Boom indices are part of the broader family of synthetic indices, designed to offer consistent volatility and unique trading opportunities around the clock. For traders seeking even more variety, Deriv also offers hybrid indices, which combine characteristics of synthetic and real market behaviour. You can learn more about these in our dedicated Hybrid Indices guide.
Why trade Crash 150 and Boom 150 indices
Crash & Boom 150 indices offer a new opportunity for traders who want greater frequency of price spikes, with a crash or boom, on average, every 150 ticks. This sets them apart from the higher-numbered indices and adds flexibility and fresh strategies to your synthetic index trading.
We always recommend starting to trade Crash & Boom indices on a Deriv demo account to become familiar with tick frequency and price action before moving on to real account trading. As you transition, it’s important to practise effective risk management and use position sizing strategies risk management techniques to help protect your capital and optimise your trading outcomes
Quiz
How often do price spikes (crashes or booms) occur, on average, on the Crash 150 and Boom 150 indices?
FAQs