.png)
If you already trade classic Crash or Boom Indices, Crash Boom Flip Indices will feel immediately familiar. Both share the same tick-based structure, appear on the same Deriv platforms, and use identical trading mechanics. The key difference is in how direction works, and what it means for every large move on the chart.
How Crash and Boom Indices move
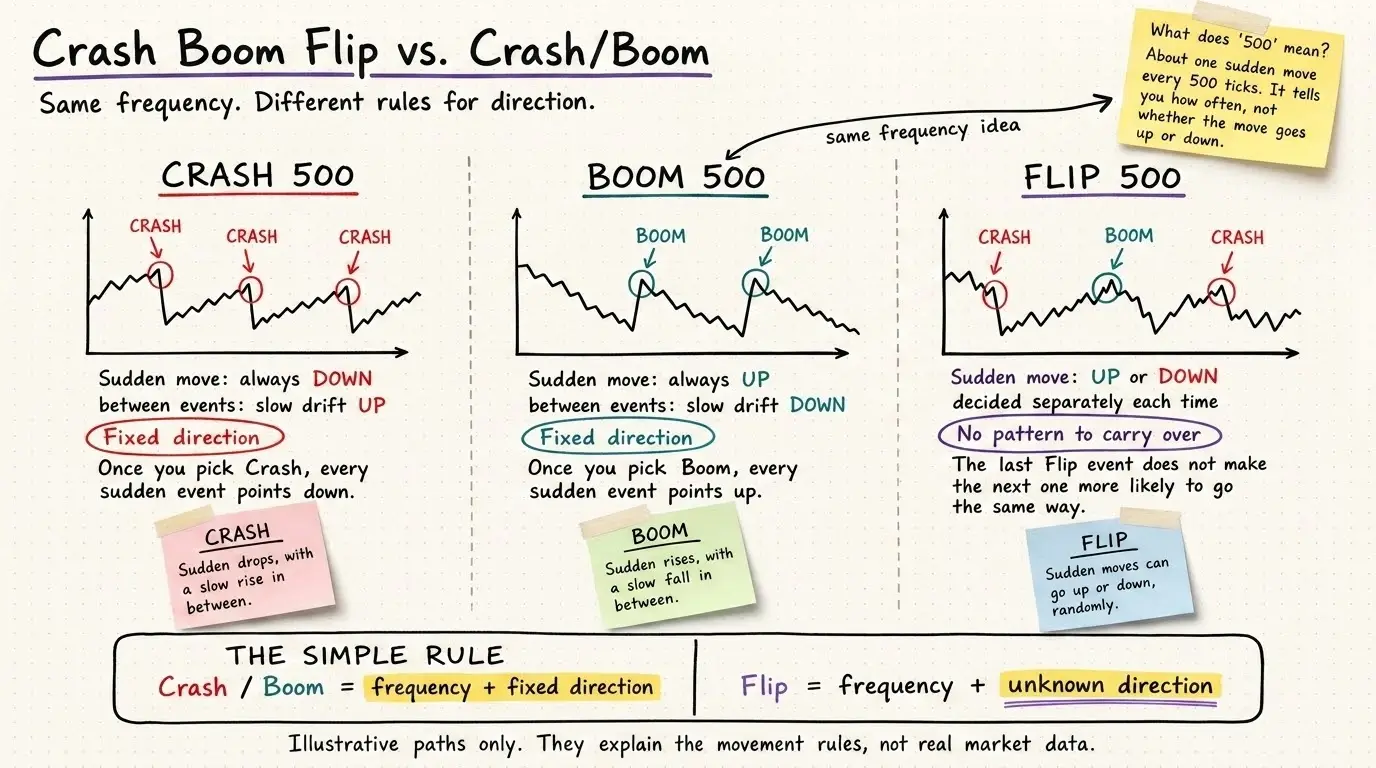
A Crash Index trends upwards gradually, then drops suddenly. It then resumes climbing until the next drop. A Boom Index trends downwards gradually, then spikes upwards suddenly. It then resumes falling until the next spike. For both, the direction of every sudden move is permanent: Crash Indices always drop on large moves, Boom Indices always spike upwards. The number in the index name reflects how frequently those moves occur on average.
For example, a Crash 500 index experiences a large move on average once every 500 ticks, while a Crash 1000 index experiences one on average once every 1,000 ticks. A tick is a single price update. The lower the number, the more frequently large moves occur; the higher the number, the longer the average interval between them. The number describes event frequency, not direction.
What changes with Flip
Unlike classic Crash or Boom Indices, a Flip Index doesn’t have a fixed, permanent direction. Instead, it alternates between two phases. In its Crash phase, it climbs upwards gradually while carrying the risk of a sudden drop. In its Boom phase, it declines downwards gradually while carrying the risk of a sudden spike upwards.
What makes Flip Indices distinct is what can happen at the moment of each large move. When a large move occurs, it may flip the phase, ending a slow climb upwards and beginning a slow decline downwards, or the other way around. Other times, the move is absorbed and the index continues in the same direction as before. You can tell which happened by watching whether the gradual drift changes direction after the move.
The numbering system works the same way as the classic family: a Flip 500 Index has large moves on average once every 500 ticks, just like a Crash 500 or Boom 500. But while the number tells you how often a large move arrives, it says nothing about direction. Because direction is determined by whichever phase is currently active, and that can change.
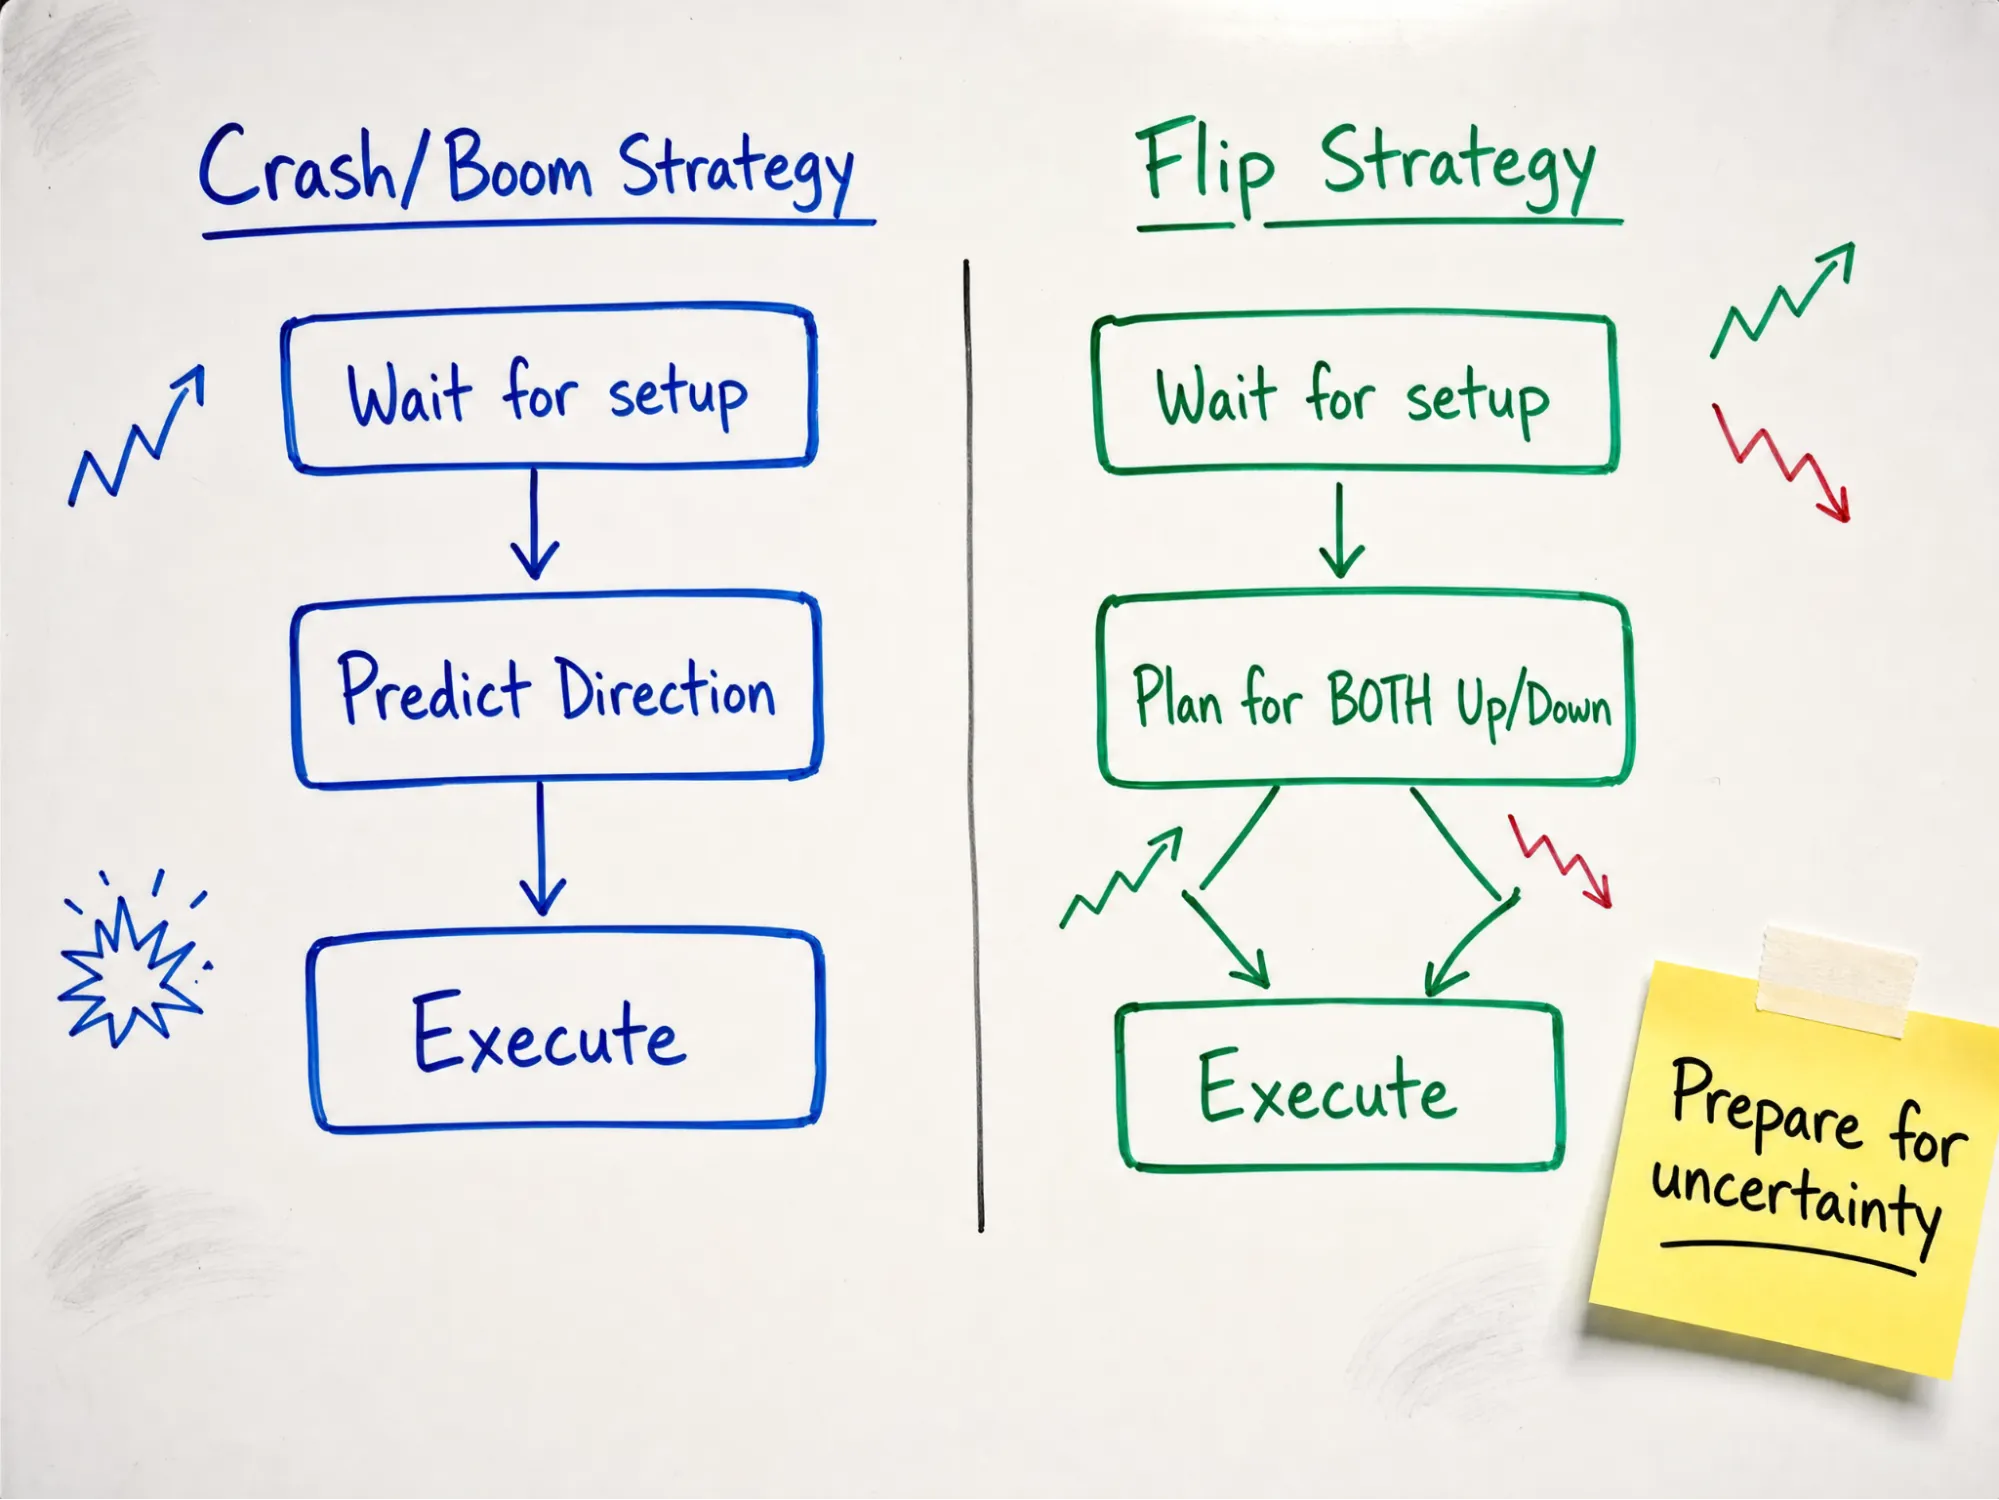
Because large moves can go either way depending on the current phase, strategies built entirely around fixed directional moves from classic Crash or Boom Indices will need to be adapted. Risk management, position sizing, and entry timing all need to account for a two-phase structure where both drops and spikes upwards are possible on the same instrument.
A quick side-by-side
What this means for your trading
When Deriv launches Flip Indices, traders gain access to a dynamic market structure designed to expand traditional trading strategies.
The Flip Index's two-phase structure opens it up to a wider range of approaches than a classic Crash or Boom Index.
- Trend traders get clearly defined phases to work with. The direction of the gradual drift tells you which regime is currently in play.
- Reversal traders get turning points anchored to visible events on the chart, rather than ones that arrive silently.
- Spike traders no longer have to choose between a Crash and a Boom symbol. One instrument produces both downward drops and upward spikes over time.
Whatever the approach, the same discipline applies as with every Synthetic Index: the timing of any individual large move is random. The number in the index name describes a long-run average, so no amount of tick-counting can tell you when the next large move, or the next phase turn, will arrive. Position sizing and stop placement matter here exactly as much as they do on classic Crash and Boom Indices.
If you want to understand what Flip Indices are and how they work in more detail, this resource provides an in-depth explanation.
Choosing between them
- Choose Crash or Boom Indices if you prefer trading with a fixed, known direction and a consistent movement pattern around sudden spikes or drops.
- Choose Flip Indices if you prefer two-phase market movements where both drops and spikes upwards are possible on the same instrument, and where large moves can mark turning points as well as continuations.
- Trade both to diversify your approach. These indices operate independently, so activity on classic Crash or Boom Indices has no effect on Flip Indices.
Compare them yourself
The best way to understand how these indices differ is to observe them live on price charts. Open a free Deriv demo account to chart classic Crash, Boom, and Flip Indices side by side to practise strategies with virtual funds.
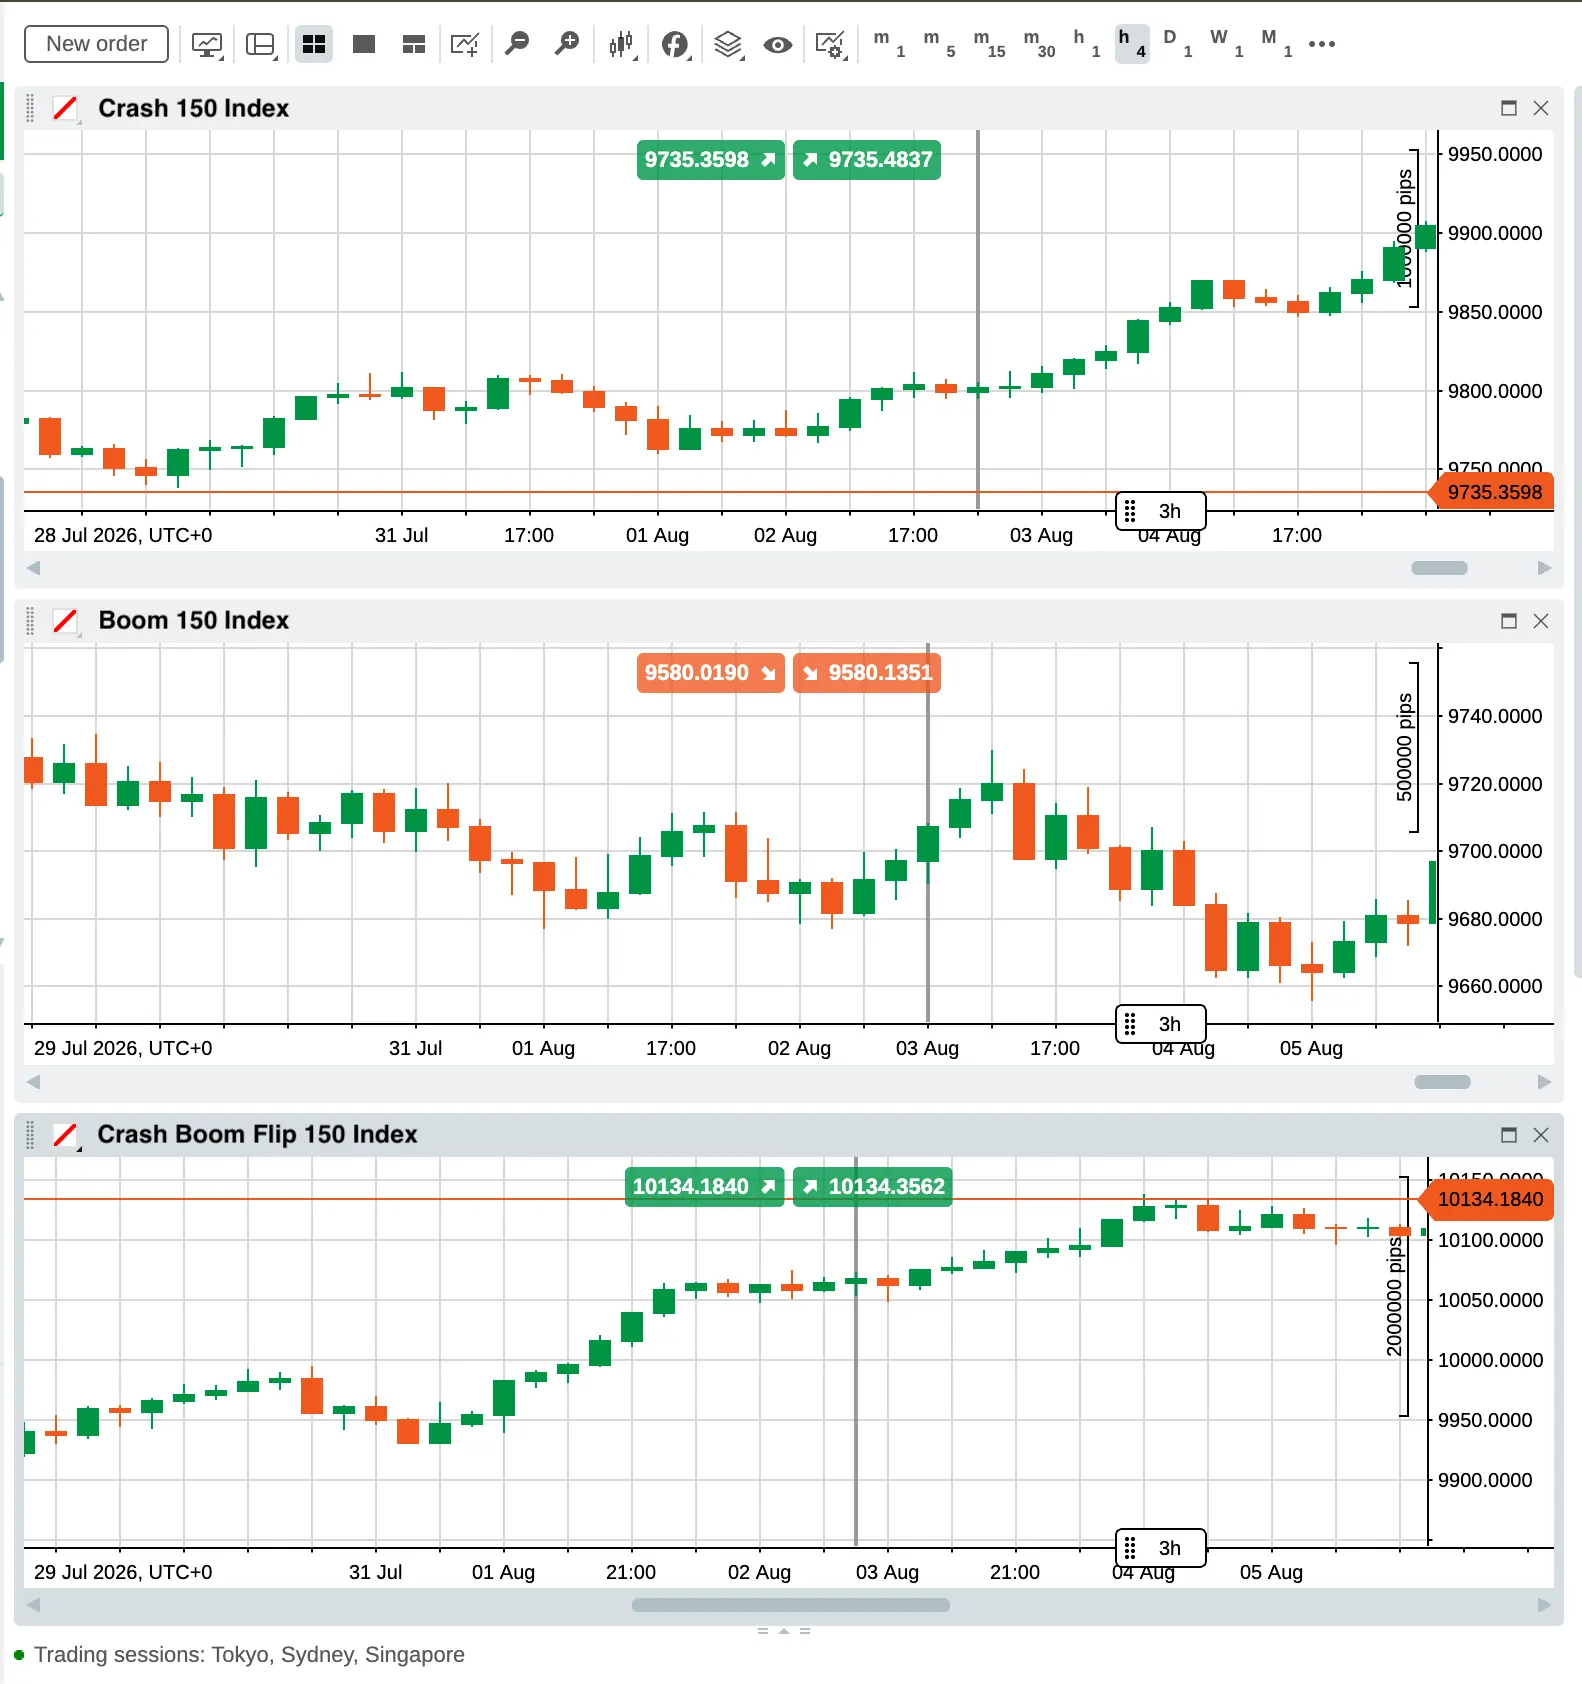
Watch each chart for a few minutes. On a Crash or Boom Index, you’ll notice a consistent cycle in one direction: drop, slow climb upwards, drop, or spike upwards, slow decline, spike upwards. On a Flip Index, watch what the price does immediately after each large move: If the gradual drift changes direction, the phase has turned. If it continues the same way, the move was absorbed. That distinction is the clearest sign of what makes Flip Indices a different instrument entirely.
Quiz
FAQs


