Ever felt like the market speaks in riddles? Well, good news. It does, but those riddles are actually chart patterns análisis técnico candlestick patterns!
The best part? You don’t need to be a math whiz or a trading guru to spot them. Your eyes are naturally wired to find patterns, so let’s put that skill to work! But before we dive into patterns, let’s talk about their building blocks: support and resistance trend lines.
Trend lines: The backbone of chart patterns
A trend line is simply a line connecting key price points on a chart, like the opening prices over a week or month. Think of it as a guide that helps traders spot potential price movements. Whenever the price crosses this line, it’s called a breakout, which is a signal that a new trend might be forming.

Support and resistance are the most popular trend lines traders use.
Support and resistance: The market’s invisible barriers
Support and resistance levels act like invisible fences that prices struggle to break through.

- Support: The price level where a downtrend pauses or bounces back up. Imagine traders rushing in to buy an asset when it’s cheap, stopping the price from dropping further.
- Resistance: The price level where an uptrend slows down or reverses. It’s where traders start selling, preventing the price from climbing higher.
Let’s bring this to life with an example:
Imagine gold prices have been sliding for days. At $50 per gram, buyers flood in, pushing prices back up. That $50 level becomes a support level.
Now, let’s say gold climbs to $100 per gram. Some traders who missed the dip decide it’s time to sell. Supply outweighs demand, and prices stall. That $100 level is now a resistance level.
Prices often bounce between these levels, forming trends. But when they break through support or resistance, a strong new trend could be on the horizon-this is where opportunities open up for traders!
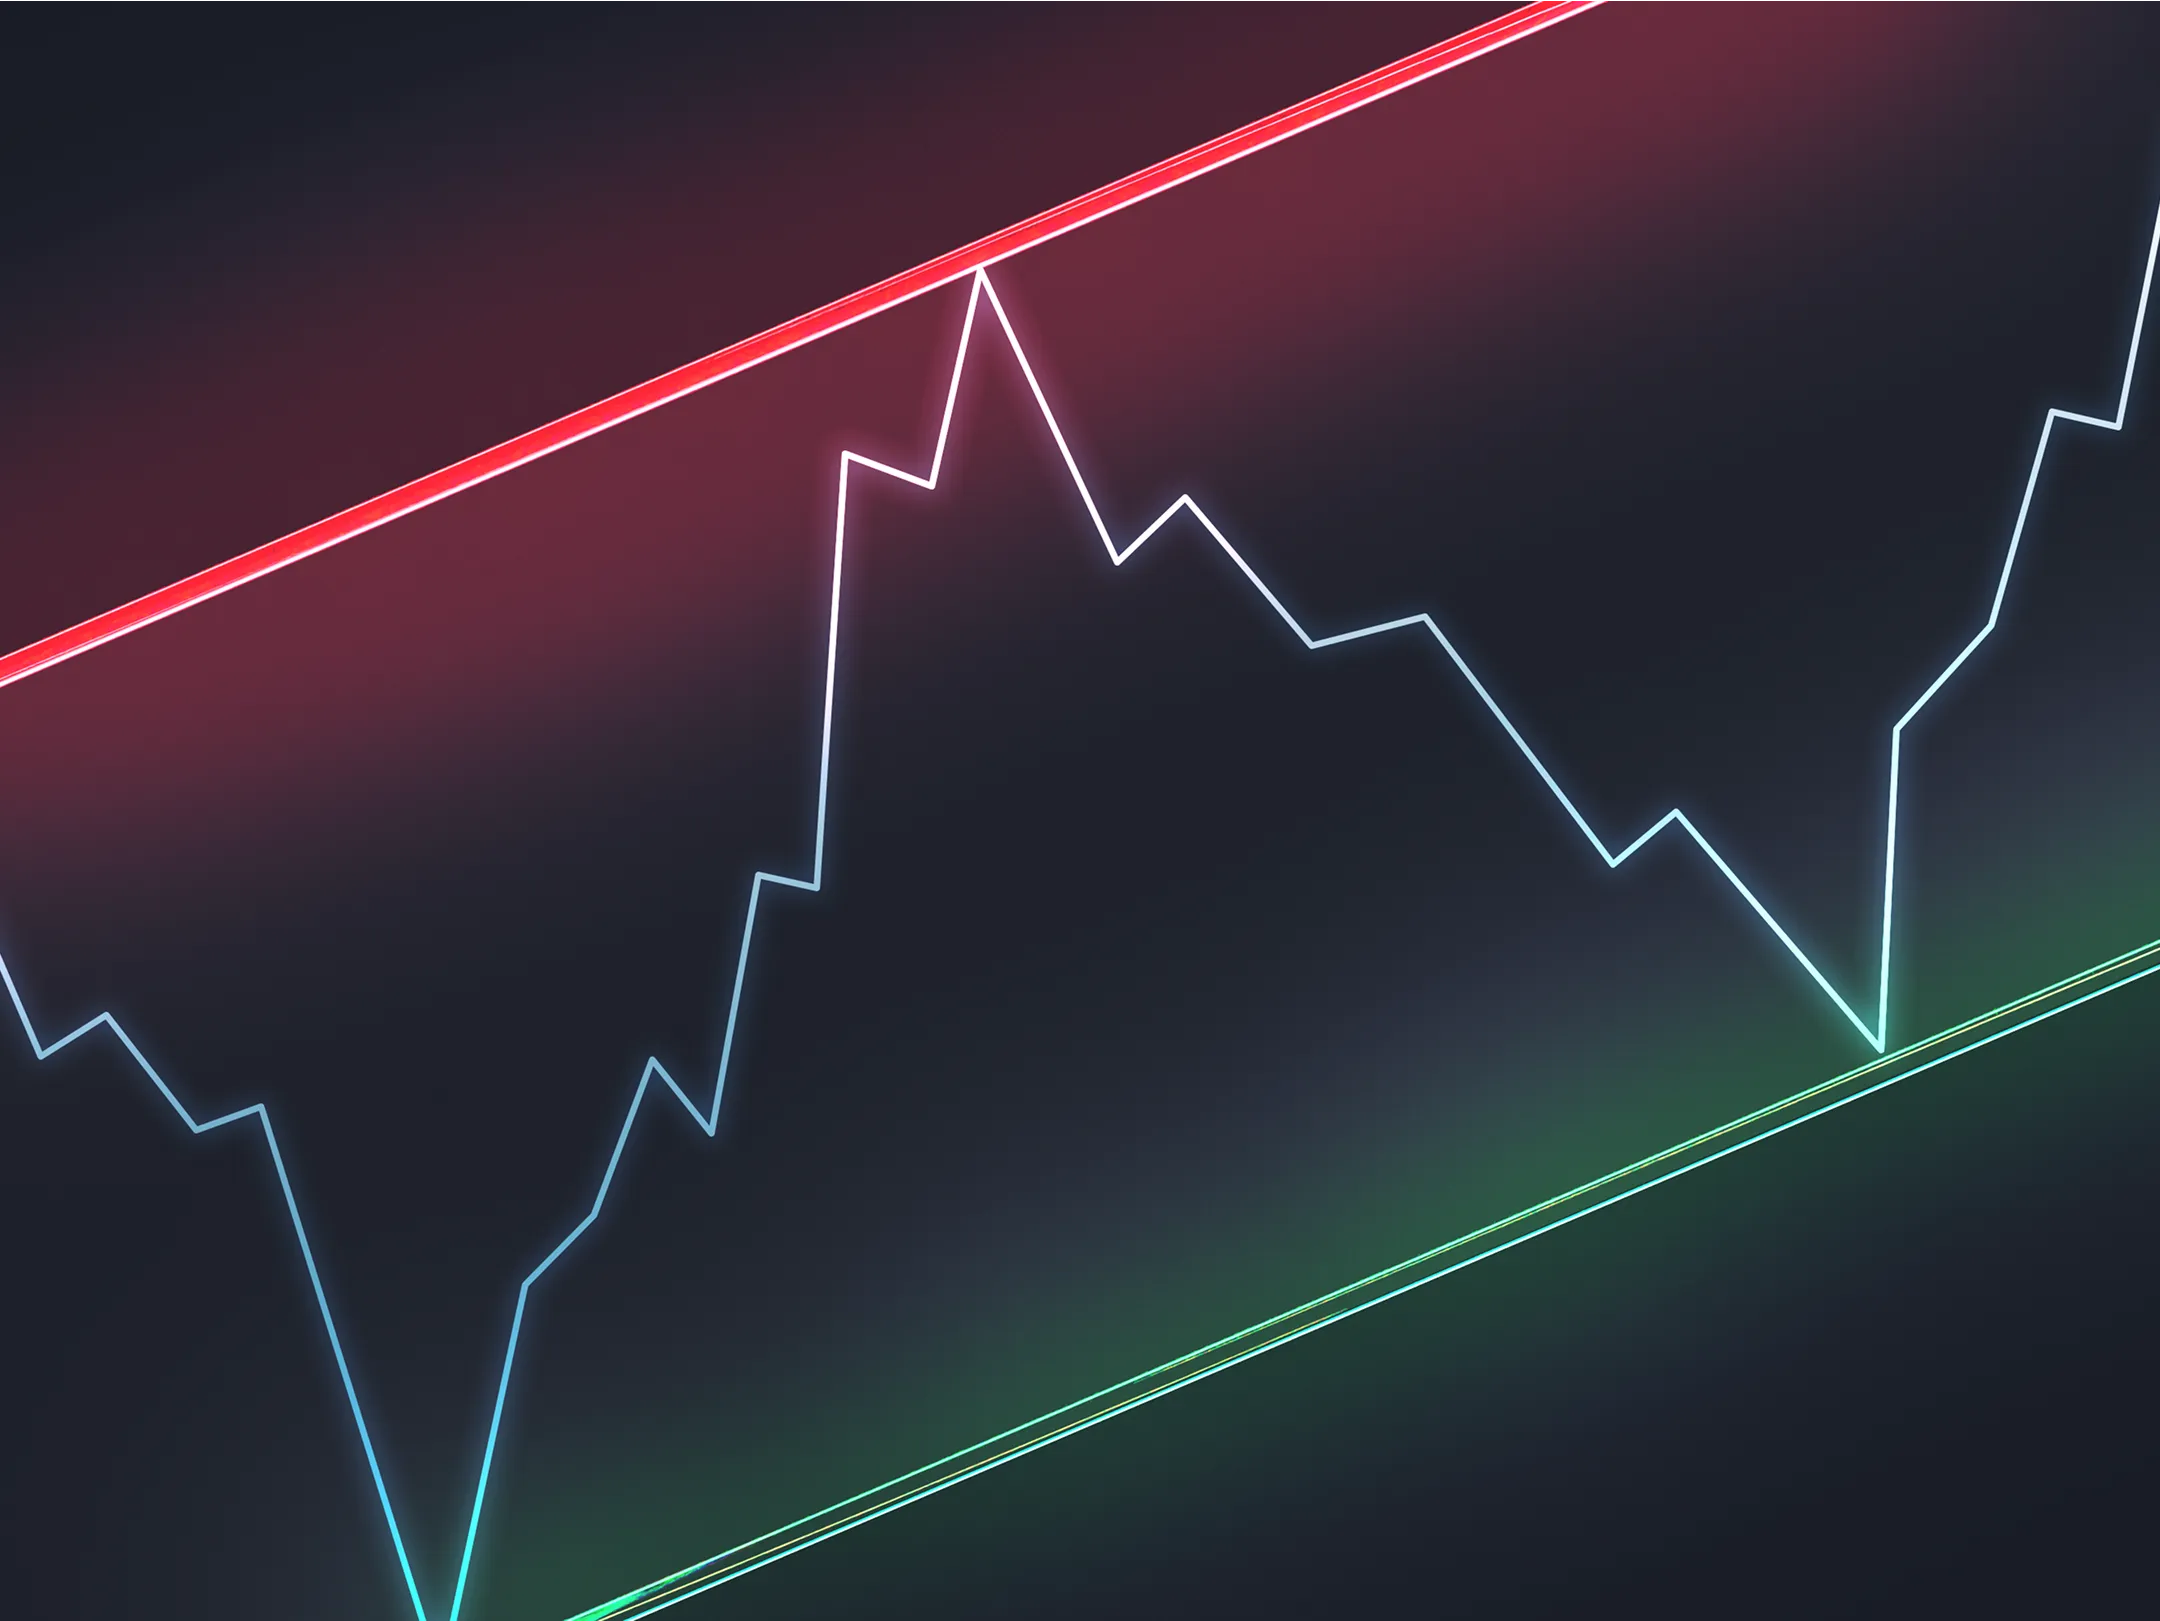
Drawing tools: Your digital sketchpad for trading plataforma Deriv Trader
To spot trends, you’ll need to draw support and resistance lines on your price charts. That’s where drawing tools come in handy! Most trading platforms, including Deriv Trader, offer a variety of tools to help you map out trend lines.

Pro tip: If you’re just getting started, the Line tool is your best friend. It’s the simplest way to draw trend lines and start identifying patterns.
Here’s an example of support and resistance trend lines created using the Line tool on an ETH/USD candlestick chart in Deriv Trader:

Turning trend lines into trading strategies trading strategies
Simply knowing support and resistance levels can already give you an edge, but combining them with chart patterns can make your predictions even sharper! Spotting a pattern early can help you anticipate potential price movements and act accordingly.
Why not put your skills to the test? Open a Deriv demo account and start practicing drawing trend lines and identifying patterns in real-time, without risking real money.
Happy trading!
Cuestionario
¿Cuál es la función principal de los niveles de soporte y resistencia en un gráfico de trading?
Preguntas frecuentes