Fibonacci retracements are widely used for identifying potential market turning points technical analysis. They help identify key support and resistance zones using simple support and resistance zones, well-known mathematical ratios. Here's how they work. No advanced math needed.
What’s the deal with Fibonacci numbers?
Fibonacci numbers are a mathematical sequence where each number sums the two before it. For example: 0, 1, 1, 2, 3, 5, 8, 13, 21… and so on.
This pattern shows up everywhere in nature: from the spirals of seashells to the way sunflower seeds are arranged. These proportions also appear in market price behaviour — impressive precision in action.
How Fibonacci retracement levels work
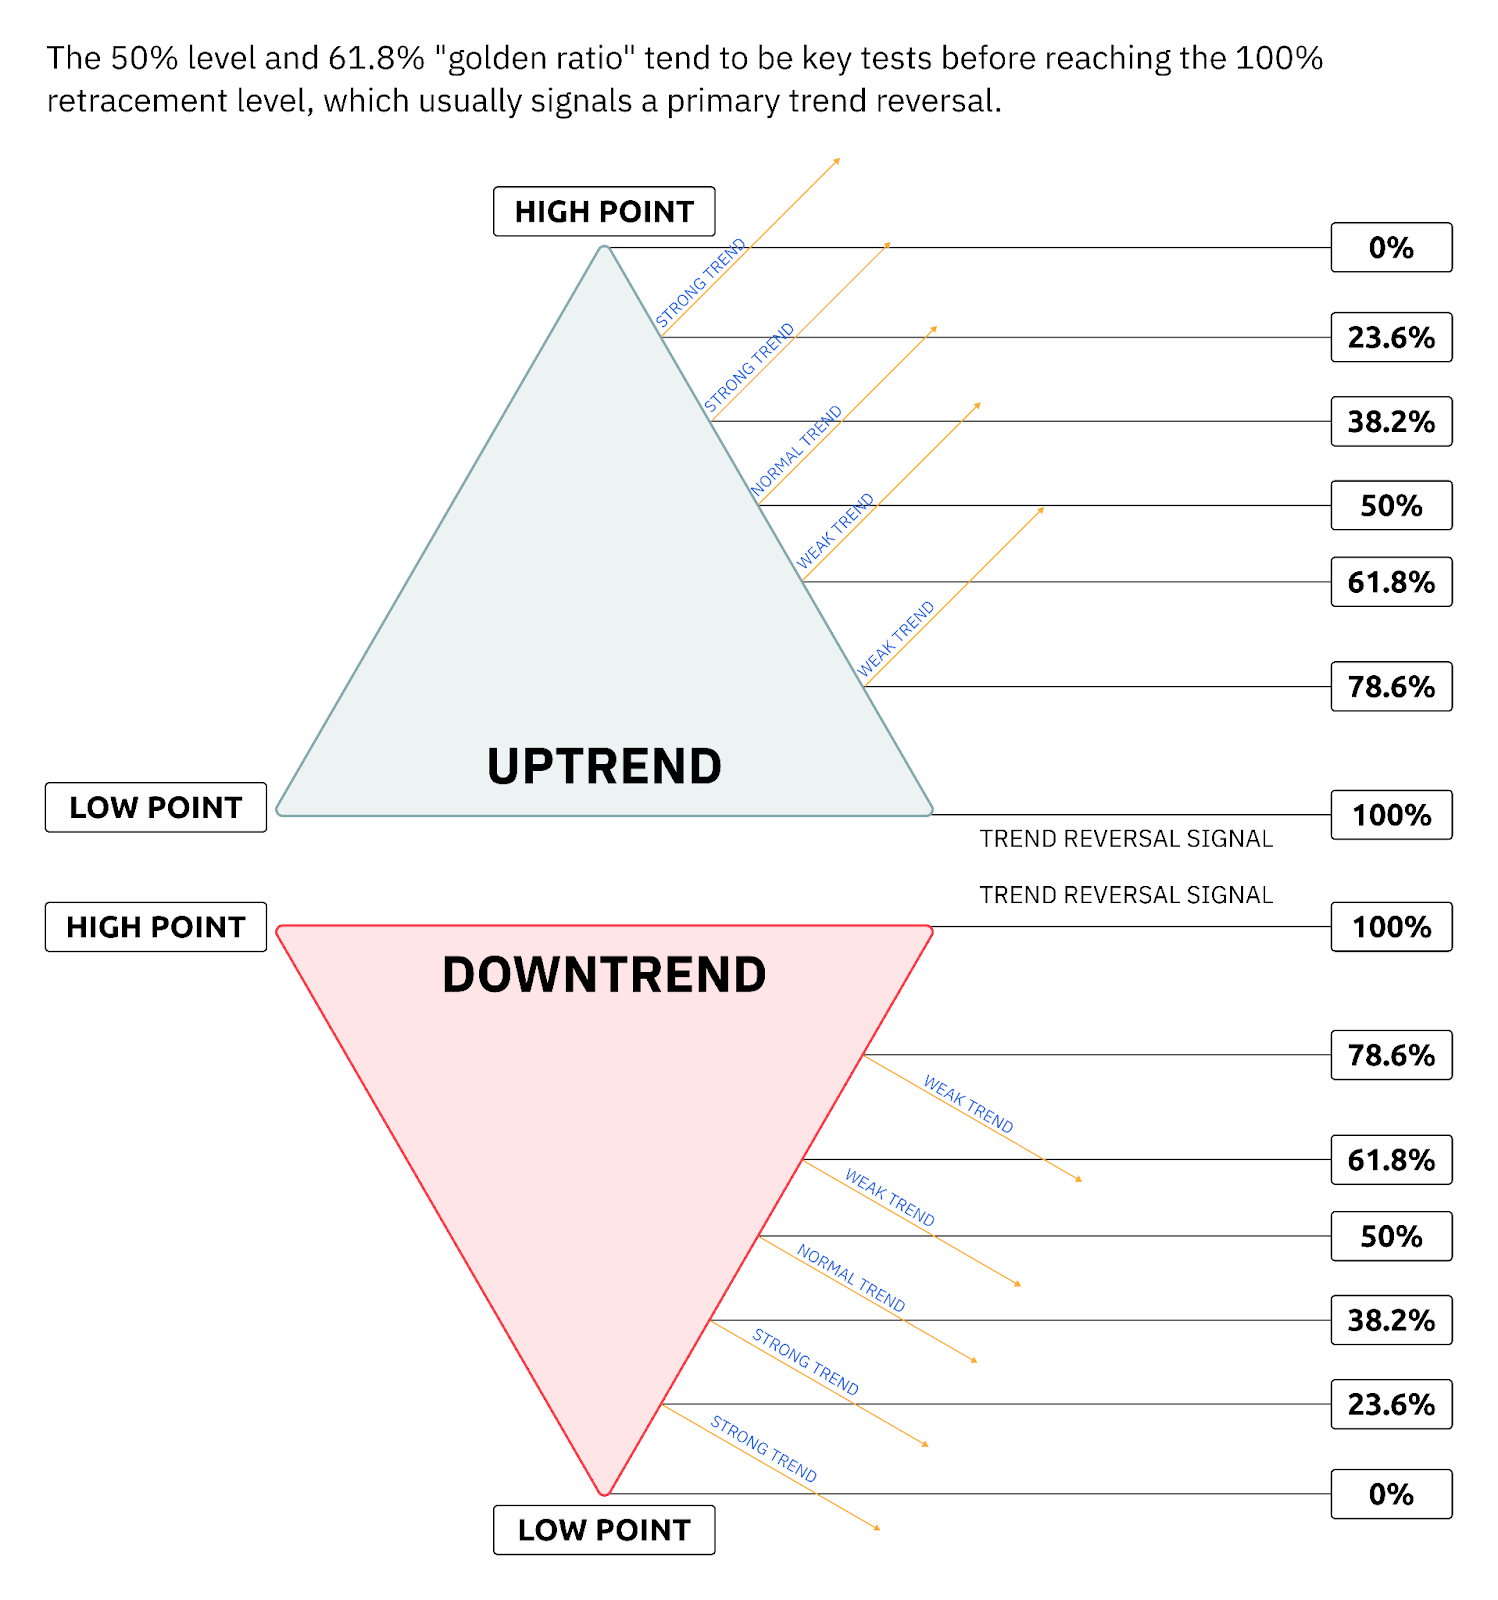
The Fibonacci retracement tool builds horizontal levels at key percentages based on a price move, helping anticipate support or resistance zones. These key levels are:
- 0% (starting point of the trend)
- 23.6%
- 38.2%
- 50% (not officially a Fibonacci number, but traders love it)
- 61.8% (the golden ratio, aka the magic number)
- 78.6%
- 100% (end of the trend)
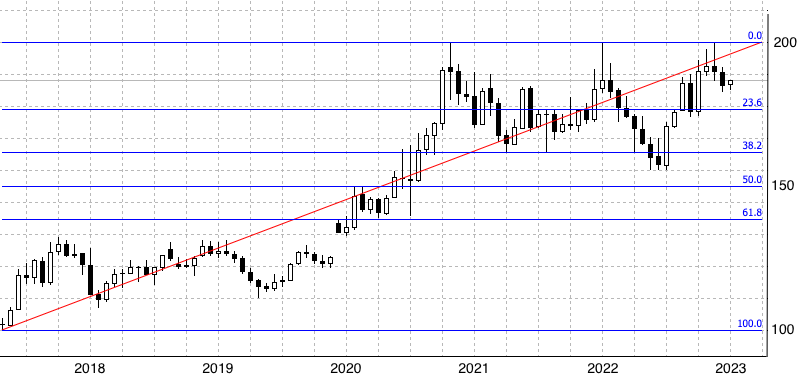
Here's how to apply them in practice. Find a big price move (up or down), and the retracement levels will help predict where the price might take a breather or reverse.
Spotting Fibonacci levels in action
Let’s say the price of an asset shoots up from $100 to $200. If it retraces, i.e., pulls back, you might expect support around key Fibonacci levels. For example, a 50% retracement means the price could dip to $150 before bouncing back.
Different levels mean different things:
- 23.6% - 38.2%: Minor retracements, often in strong trends.
- 50% - 61.8%: Key zones where price tends to stall or reverse.
- 78.6% - 100%: Deeper pullbacks with potential reversal zones.
How to use Fibonacci retracements in trading
You can access Fibonacci tools directly in Deriv MT5 under Insert

Ways to use Fibonacci retracement levels:
- With support/resistance: If a Fibonacci level aligns with previous highs/lows, that zone becomes even more significant.
- With moving averages: A retracement to a moving average (like the 50-day MA) can confirm a reversal.
- With candlestick patterns: A bullish engulfing candle near the 61.8% level? That’s a strong signal.
- Across timeframes: Zoom out to see major levels that bigger traders might be watching.
- With RSI or Stochastics: Oversold at a key Fibonacci level? That’s a potential buy signal.
Cuestionario
Una acción sube de $50 a $100. ¿Dónde está el nivel de retroceso del 50 %?
Preguntas frecuentes