يُستخدم التراجع فيبوناتشي على نطاق واسع لتحديد نقاط التحول المحتملة في السوق في التحليل الفني. يساعد في تحديد مناطق الدعم والمقاومة الرئيسية باستخدام نسب رياضية بسيطة ومعروفة جيدًا. إليك كيفية عملها. لا حاجة إلى رياضيات متقدمة.
ما هي خصوصية أرقام فيبوناتشي؟
أرقام فيبوناتشي هي تسلسل رياضي حيث مجموع كل رقم يساوي الرقمين السابقين له. على سبيل المثال: 0، 1، 1، 2، 3، 5، 8، 13، 21… وهكذا.
يظهر هذا النمط في كل مكان في الطبيعة: من دوامات صدفات البحر إلى ترتيب بذور دوار الشمس. وتظهر هذه النسب أيضًا في سلوك أسعار السوق — دقة مبهرة في التطبيق.
كيف تعمل مستويات التراجع فيبوناتشي
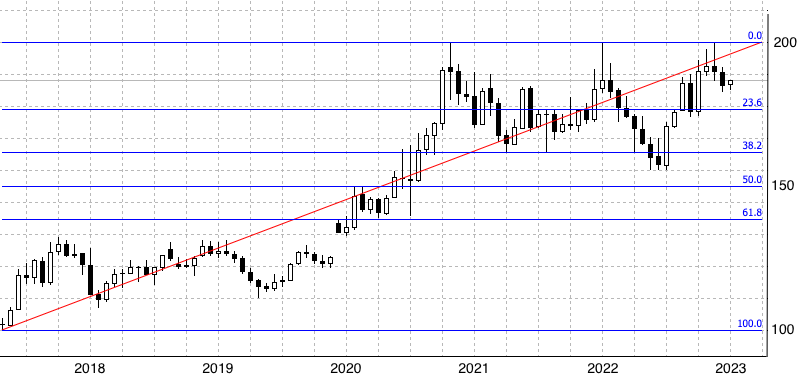
يقوم أداة التراجع فيبوناتشي ببناء مستويات أفقية عند نسب رئيسية بناءً على حركة السعر، مما يساعد على توقع مناطق الدعم أو المقاومة. المستويات الرئيسية هي:
- 0% (نقطة بداية الاتجاه)
- 23.6%
- 38.2%
- 50% (ليس رقم فيبوناتشي رسمي، لكن المتداولون يفضلونه)
- 61.8% (النسبة الذهبية، المعروفة بالرقم السحري)
- 78.6%
- 100% (نهاية الاتجاه)
إليك كيفية تطبيقها عمليًا. ابحث عن حركة سعر كبيرة (صعودًا أو هبوطًا)، وستساعدك مستويات التراجع في التنبؤ بمكان توقف السعر لأخذ استراحة أو الانعكاس.
رصد مستويات فيبوناتشي أثناء العمل
لنفترض أن سعر أصل ما ارتفع من 100 دولار إلى 200 دولار. إذا تراجع، أي ارتد، قد تتوقع وجود دعم حول مستويات فيبوناتشي الرئيسية. على سبيل المثال، تراجع بنسبة 50% يعني أن السعر قد ينخفض إلى 150 دولارًا قبل أن يرتد.
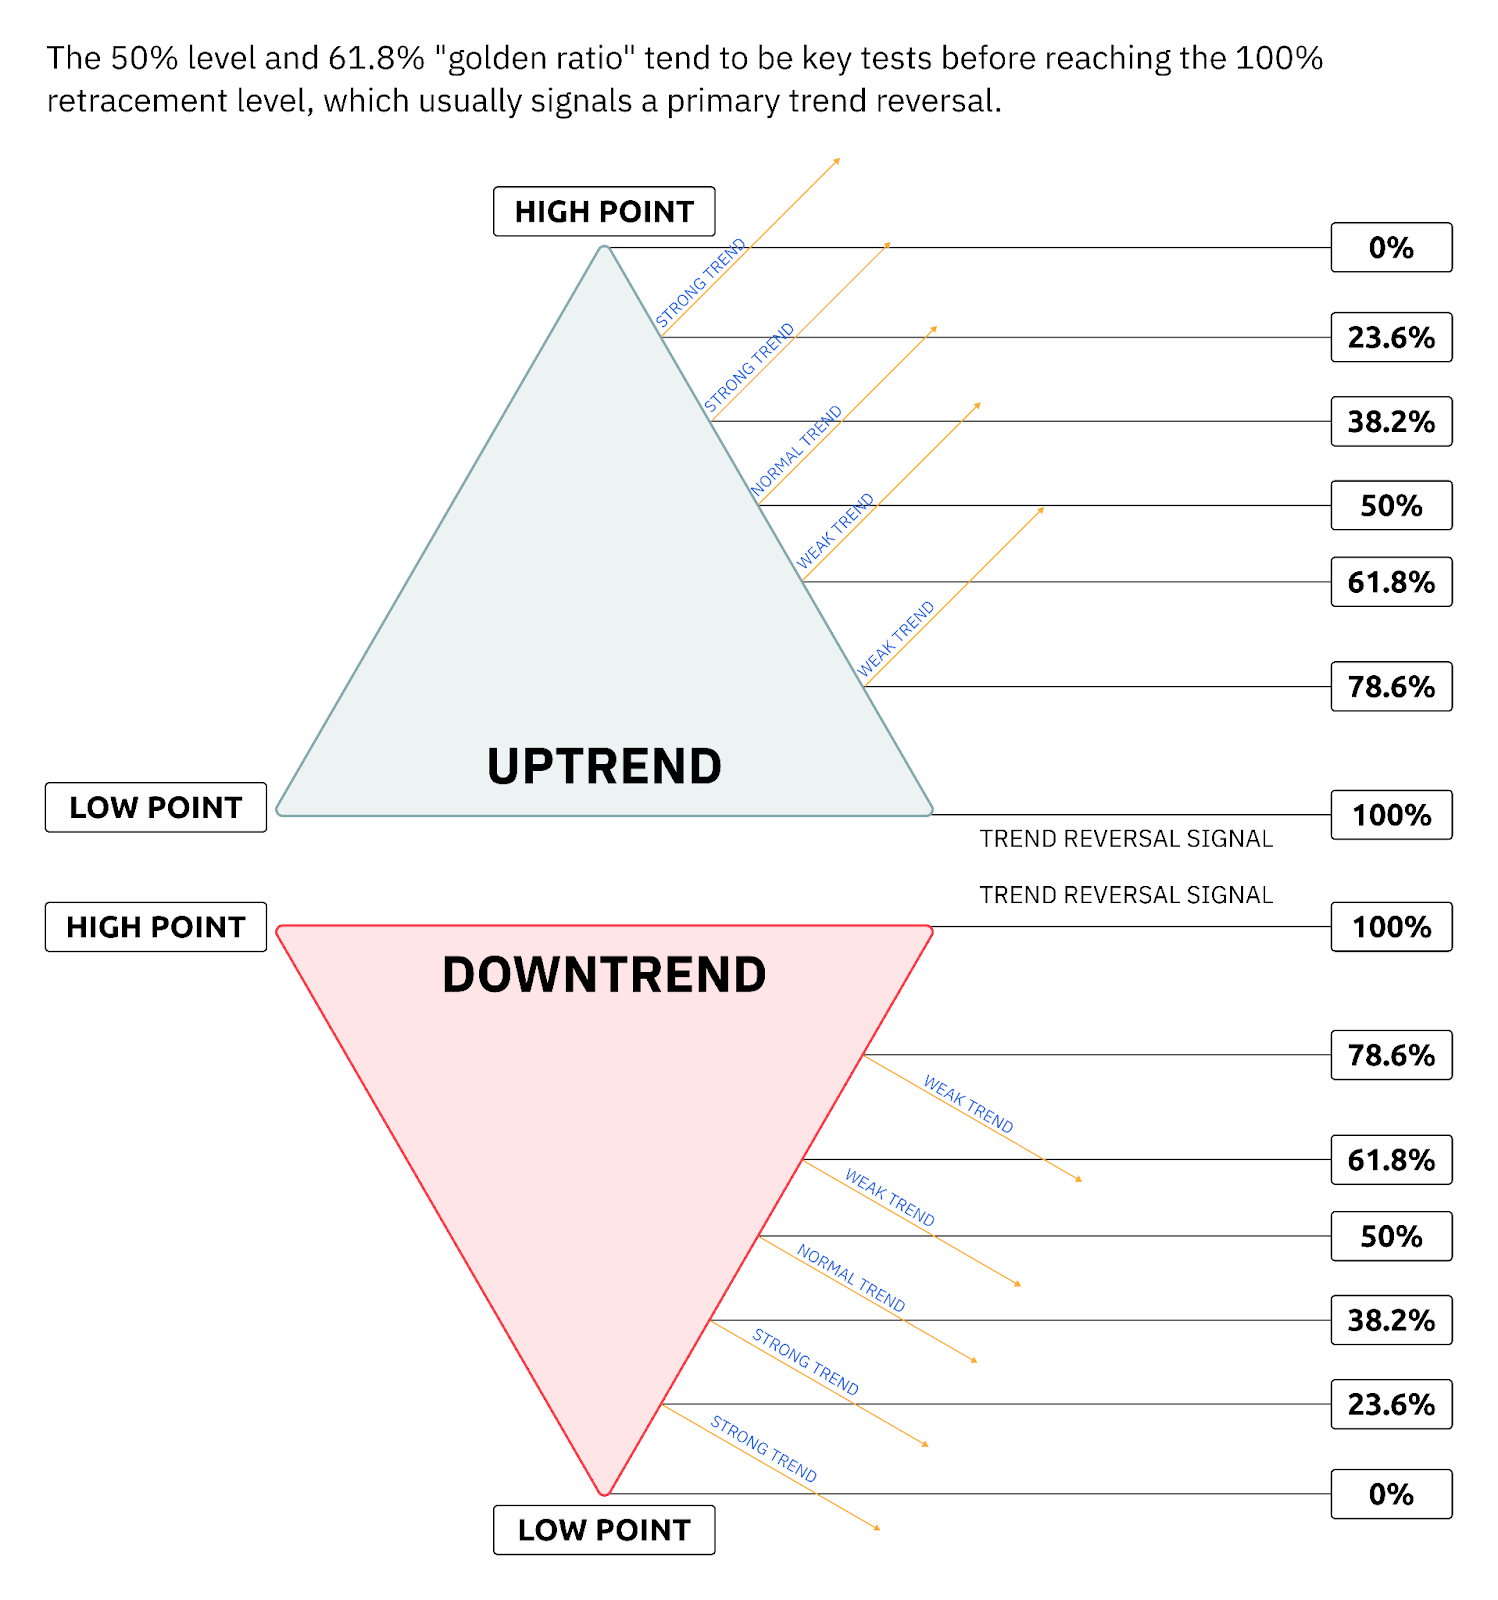
مستويات مختلفة تعني أشياء مختلفة:
- 23.6% - 38.2%: تراجعات بسيطة، غالبًا في الاتجاهات القوية.
- 50% - 61.8%: مناطق رئيسية حيث يميل السعر إلى التوقف أو الانعكاس.
- 78.6% - 100%: تراجعات أعمق مع مناطق محتملة للانعكاس.
كيفية استخدام تراجعات فيبوناتشي في التداول
يمكنك الوصول إلى أدوات فيبوناتشي مباشرة في Deriv MT5 من قائمة الإدراج

طرق استخدام مستويات التراجع فيبوناتشي:
- مع الدعم/المقاومة: إذا تزامن مستوى فيبوناتشي مع ارتفاعات أو انخفاضات سابقة، تصبح تلك المنطقة أكثر أهمية.
- مع المتوسطات المتحركة: يمكن أن يؤكد التراجع إلى متوسط متحرك (مثل المتوسط المتحرك لـ 50 يومًا) حدوث انعكاس.
- مع أنماط الشموع: شمعة ابتلاعية صاعدة بالقرب من مستوى 61.8%؟ هذه إشارة قوية.
- عبر أطر زمنية مختلفة: قم بالتكبير للخروج لرؤية المستويات الرئيسية التي قد يراقبها المتداولون الأكبر حجمًا.
- مع مؤشر القوة النسبية أو السلع العشوائية: هل السعر في منطقة تشبع بيع عند مستوى فيبوناتشي الرئيسي؟ هذه إشارة محتملة للشراء.
اختبار
قفز سهم من 50 دولارًا إلى 100 دولار. أين مستوى التصحيح 50%؟
الأسئلة الشائعة