
Vous définissez un stop-loss en vous attendant à ce que votre transaction se ferme à un niveau spécifique. Vous avez consulté votre historique de transactions et la perte est plus importante que prévu. Sur les indices Boom et Crash, cela signifie généralement que le stop-loss a bien joué son rôle de déclencheur, mais que le prix a franchi ce niveau lors d'un mouvement brusque unique et que l'ordre a été exécuté au prochain prix disponible.
Le stop-loss n'a pas échoué. Le prix d'exécution reflète l'état du marché au moment où l'ordre a été exécuté.
Voici comment fonctionne la différence entre le prix du stop-loss et le prix d'exécution.
Points clés à retenir
- Un stop-loss est le niveau de prix qui déclenche la sortie d'une transaction — ce n'est pas un prix de sortie garanti.
- Lorsque le marché franchit brusquement ce niveau, la transaction se clôture au prix disponible suivant, qui peut être plus éloigné du point d'entrée que prévu.
- Les indices Boom dérivent vers le bas et connaissent des pics vers le haut. Les indices Crash dérivent vers le haut et chutent vers le bas. Si vous vendez sur Boom, un pic à la hausse joue contre vous. Si vous achetez sur Crash, une baisse joue contre vous.
- Cela signifie que la perte réalisée sur une transaction peut être plus importante que la perte que le stop-loss était censé limiter.
- Des marges de stop-loss plus larges, des tailles de position plus petites et une compréhension du comportement des événements de pics peuvent aider les traders à planifier en conséquence.
Niveau de stop-loss vs prix d'exécution comprendre l'exécution des ordres
Le niveau de stop-loss est le prix auquel une instruction de sortie est déclenchée. Le prix d'exécution est le prix auquel la transaction se clôture réellement.
Dans un marché calme et à évolution lente, ces deux chiffres sont généralement très proches. Dans un marché qui peut évoluer brusquement en un seul tick, ils peuvent différer — parfois de manière significative. Cela est vrai sur tout marché avec un mouvement de prix rapide ou discontinu. C'est particulièrement pertinent sur les indices Boom et Crash, où les événements soudains font partie intégrante de la conception de l'instrument.
Pourquoi les pics affectent l'exécution du stop-loss
Les indices Boom et Crash partagent un comportement caractéristique : une dérive lente et régulière dans une direction, ponctuée par un événement soudain dans la direction opposée.
- Les indices Boom dérivent vers le bas par petites étapes, puis connaissent un pic brusque vers le haut à intervalles irréguliers.
- Les indices Crash dérivent vers le haut par petites étapes, puis chutent brusquement vers le bas à intervalles irréguliers.
La direction du pic ou de la chute détermine quelles transactions sont affectées. Par exemple:
- Si vous vendez sur un indice Boom, vous spéculez sur une baisse du prix. Un pic vers le haut fait évoluer le prix dans la direction opposée à votre transaction. Lorsque le pic se déclenche, le prix peut sauter au-dessus de votre stop-loss en un seul tick.
- Si vous achetez sur un indice Crash, vous spéculez sur une hausse du prix. Une chute vers le bas fait évoluer le prix dans la direction opposée à votre transaction. Lorsque la chute se déclenche, le prix peut tomber en dessous de votre stop-loss en un seul tick.
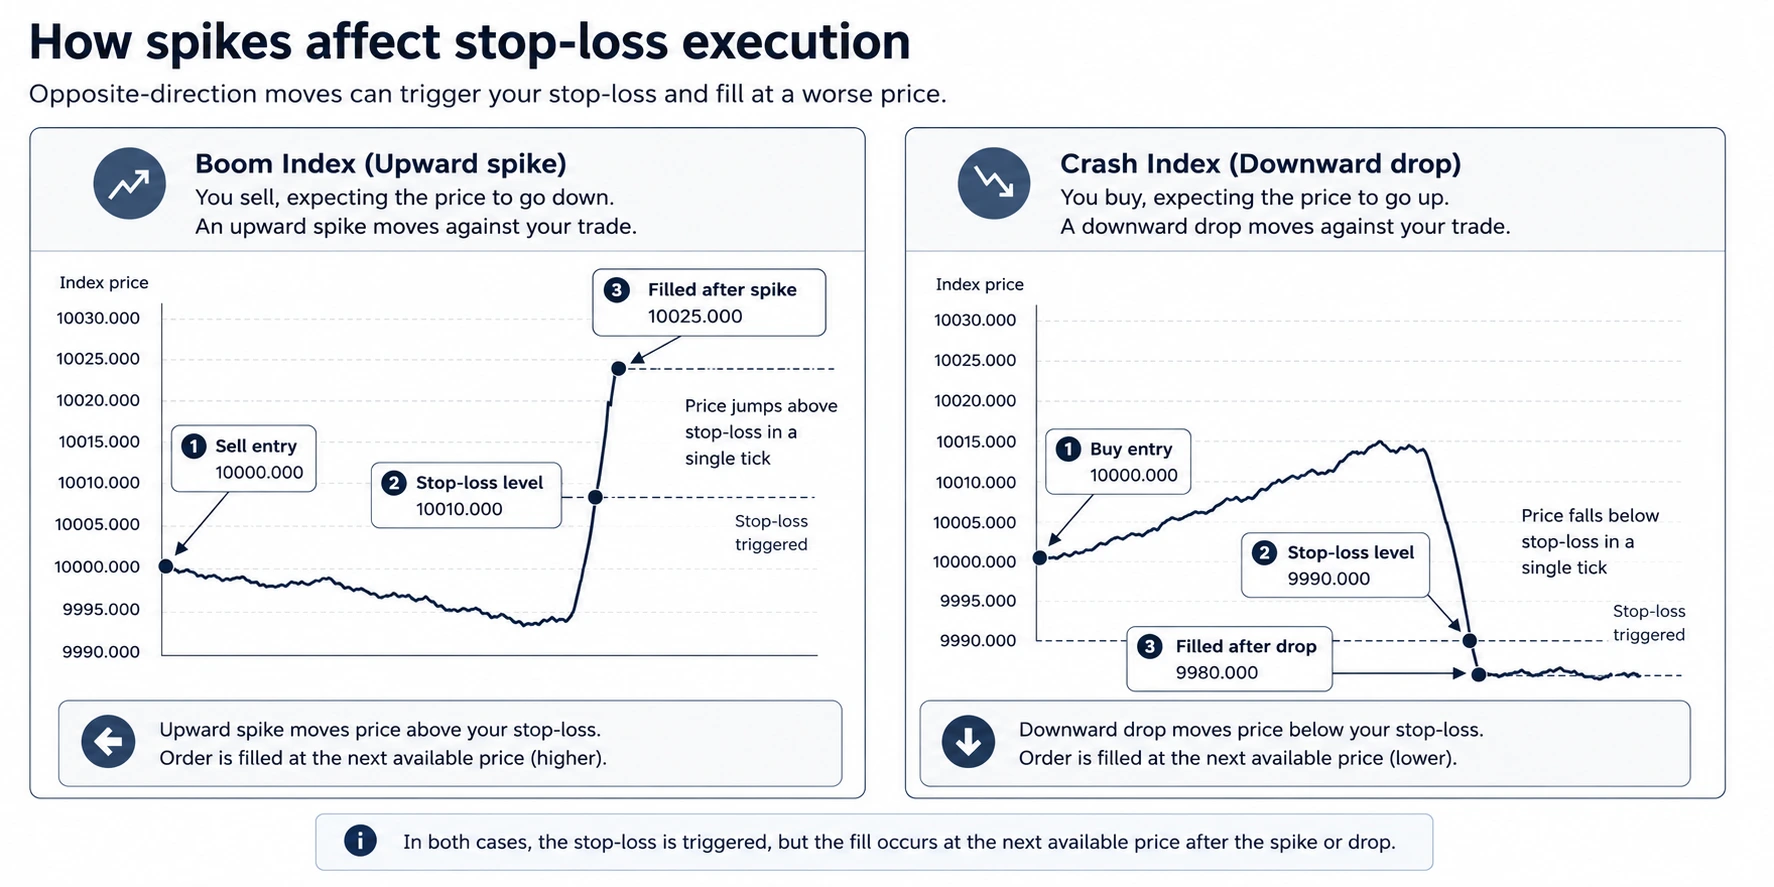
Dans les deux cas, le stop-loss est déclenché, mais au moment où l'ordre est exécuté, le prix a déjà dépassé le niveau de déclenchement. L'ordre se clôture au prochain prix disponible.
Un exemple concret
Un trader ouvre une position de vente sur un indice Boom à 10000.000, avec un volume de 0.50 et un stop-loss fixé à 10010.000.
Le risque prévu est :
- 10010.000 − 10000.000 = 10 points
- 10 × 0.50 = 5,00 $ de risque prévu
Un pic se déclenche. L'ordre est exécuté à 10025.000 au lieu de 10010.000.
La perte réalisée est :
- 10025.000 − 10000.000 = 25 points
- 25 × 0.50 = 12,50 $ de perte réalisée
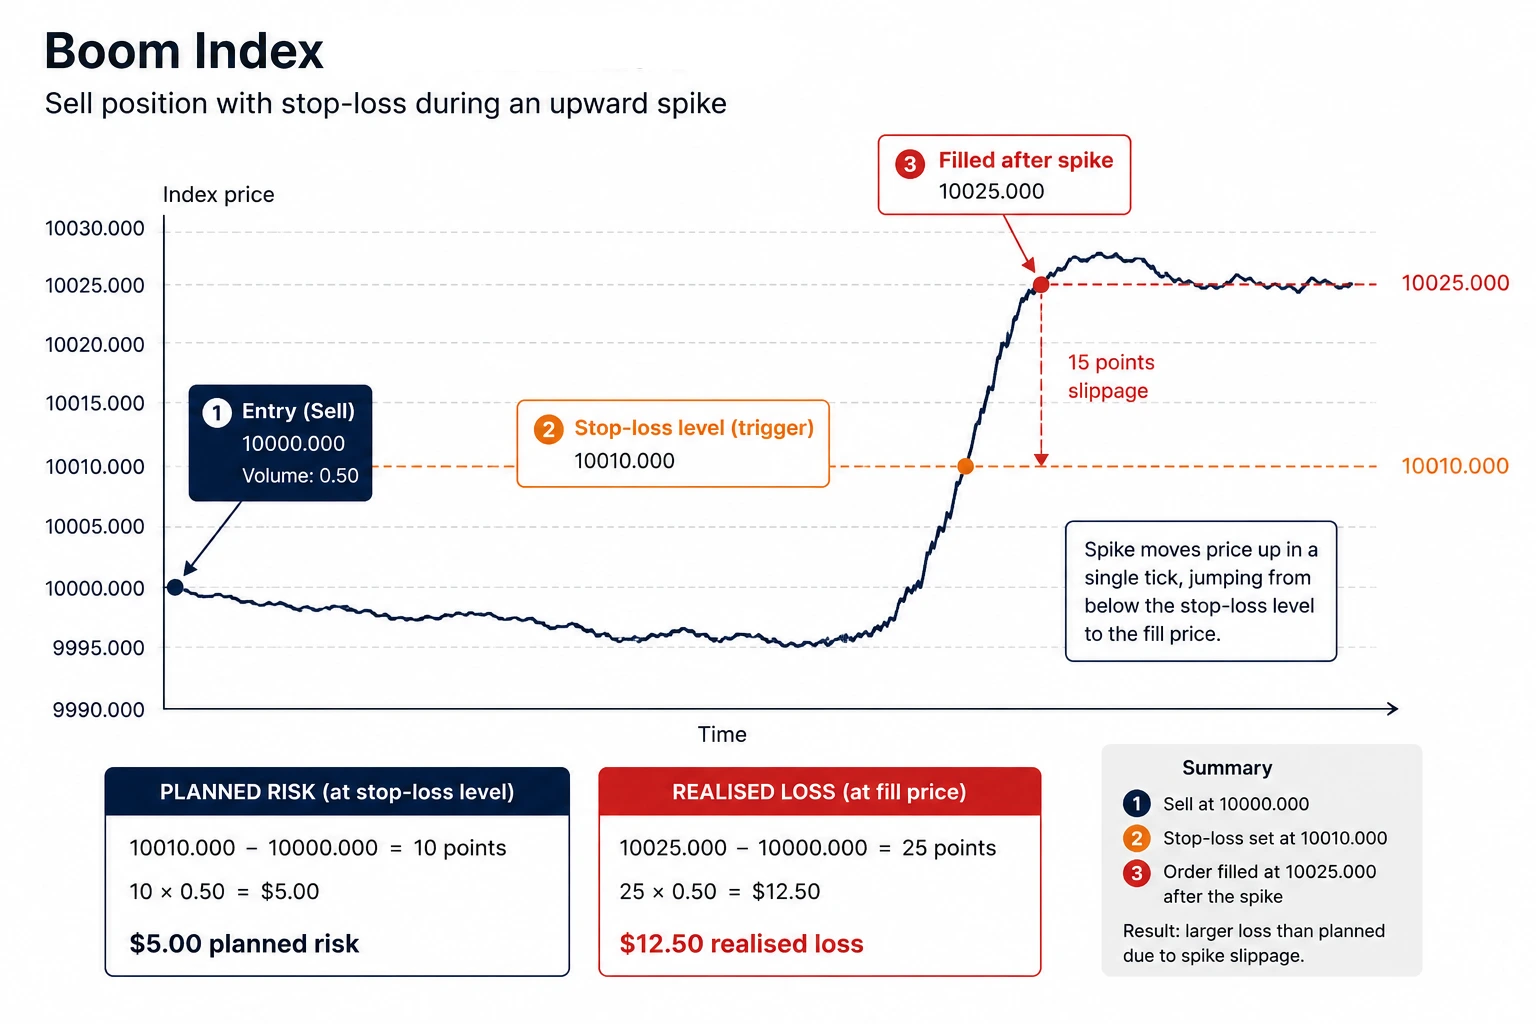
Le stop-loss a fonctionné comme prévu : il a déclenché une sortie. L'exécution s'est produite au prix que le marché offrait après le pic.
Le stop-loss a-t-il échoué ?
Non. Le stop-loss a fait ce qu'un stop-loss est censé faire : il a déclenché une sortie une fois que le prix a atteint le niveau que vous avez défini. Ce qui peut différer, c'est le prix auquel l'ordre est ensuite exécuté. Sur les instruments où le prix peut évoluer de manière discontinue — comme les indices Boom et Crash lors d'un pic — le prix d'exécution peut se situer au-delà du niveau de déclenchement.
Un stop-loss standard est une instruction de clôture, et non une sortie garantie au prix exact du stop.
Comment les traders peuvent anticiper les pics de volatilité gestion des risques en trading
Les événements de pics sur les indices Boom et Crash font partie de la conception de l'instrument. Ils sont imprévisibles quant au moment mais cohérents dans leur nature. Quelques points à considérer :
- Des marges de stop-loss plus larges. Un stop serré sur un instrument sujet aux pics présente une probabilité plus élevée d'exécution à un prix au-delà du déclenchement.
- Des tailles de position plus petites. Un volume plus petit maintient l'exécution dans le pire des cas dans une fourchette tolérable, même lorsqu'un glissement se produit.
- Comprendre la fréquence des pics. Le nombre dans le nom de l'indice (par exemple Boom 900) fait référence à la fréquence moyenne des pics sur de nombreux ticks. Chaque tick est indépendant — un pic n'est pas plus probable simplement parce qu'il ne s'est pas produit depuis un moment.
- Vérifier les spécifications du contrat. Les détails concernant le spread, le swap et la taille du lot sur les indices Boom et Crash sont disponibles sur la plateforme et méritent d'être examinés avant de dimensionner une transaction.
Ce qu'il faut vérifier si votre perte semble plus élevée que prévu
Si une perte réalisée semble plus importante que ce que le stop-loss aurait dû permettre, l'historique des transactions devrait montrer ce qui s'est réellement passé. Détails utiles à recueillir :
- ID de position
- Prix d'entrée
- Niveau de stop-loss
- Prix de clôture
- Volume
- Horodatage de la clôture
- Journal de trading et logs d'exécution
Ces détails ensemble racontent une histoire complète de la façon dont la transaction a été ouverte, où le stop-loss a été défini et où l'ordre a effectivement été exécuté.
Quand contacter le support
Si le prix d'exécution, l'horodatage ou l'historique de position ne correspond pas à ce qui apparaît dans votre plateforme de trading, partagez l'ID de position avec l'équipe de support Deriv pour examen (vous pouvez également prendre une capture d'écran de l'historique de position à partager avec notre équipe de support). Le support peut vérifier l'ordre par rapport aux enregistrements d'exécution et confirmer ce qui s'est passé du côté de la plateforme.
Avertissement :
Les produits proposés sur nos plateformes sont des produits dérivés complexes qui comportent un risque important de perte d'argent. Assurez-vous que vous comprenez bien le fonctionnement de ces produits et que vous pouvez vous permettre de prendre le risque élevé de perdre votre argent. Les chiffres de performance cités se réfèrent au passé, et la performance passée n'est pas une garantie de performance future ni un guide fiable de la performance future.
Cet article est fourni à des fins éducatives uniquement et ne constitue pas un conseil financier ou d'investissement.
Quiz
FAQ


